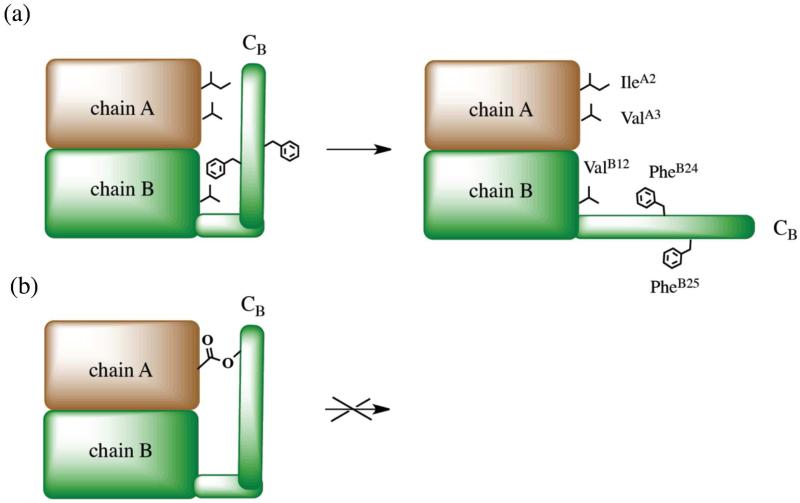
Figure 6. Conformation affects insulin binding to its receptor.
(a) Schematic illustration of conformational change of insulin upon its binding to the receptor, after Weiss et al.49 Chains A and B are schematically shown as brown and green regions, respectively. Residues IleA2, ValA3, ValB12, PheB24, and PheB25 implicated in binding to the insulin receptor are schematically shown. (b) Schematic model of ester insulin ‘locked’ in an unproductive conformation by the ester tether.

