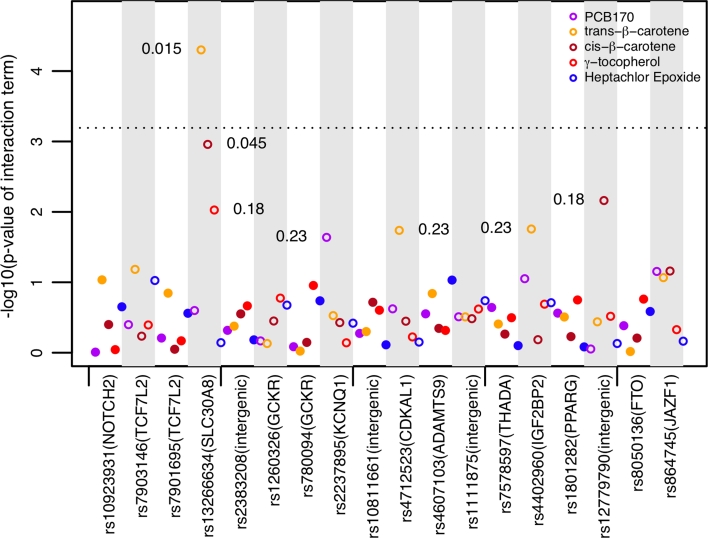
Fig. 2.
Significance values of interaction term [−log10(p value) for interaction term of pair of factors]. SNPs are on the x axis and environmental factors are color-coded above each SNP. Markers alternate between filled and open for each locus. The y axis shows −log10(p value). Interactions with p value ≤0.05 are annotated with their FDR. The dotted line denotes the Bonferroni threshold. One finding (the interaction between rs1326634 and trans-β-carotene; FDR = 1.5 %) was above the line

