
Figure 3.
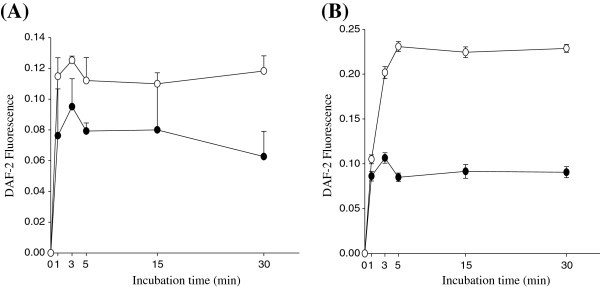
Time-course of TE-induced NO release in HUVECs (A) and EA.hy926 (B) cells. Cells were exposed to TE (○) or 1% DMSO (● control) and time-dependent NO release was quantified at 0, 1, 3, 5, 15, and 30 min using DAF-2. Each point represents mean ± SD from three separate wells per condition.