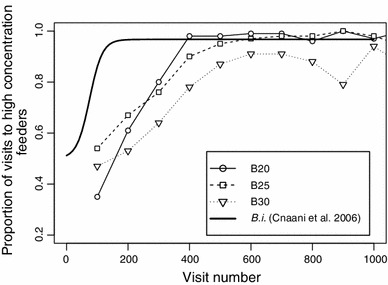
Fig. 2.

Learning curves for B. impatiens in sucrose discrimination tasks. Open symbols give the proportion of visits to the higher concentration feeders calculated over bins of 100 visits. For each of the three focus individuals from this study, the steepest learning curves from the complete data sets were selected. For B20, B25, and B30, data were taken from the first 1,000 visits on days 4, 8, and 7, respectively. The thick line is calculated from the learning curve parameters estimated in a previous study with B. impatiens (Cnaani et al. 2006: Table 2, ‘Concentration 30’). The concentrations used in that study were 13 and 40 % (weight/weight)
