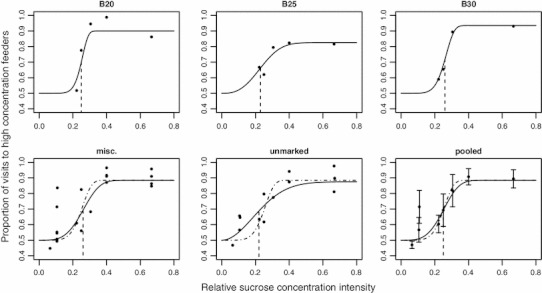
Fig. 3.

Psychometric curves for sucrose concentration discrimination. Sucrose concentration intensities are given on the abscissa and are calculated as the absolute value of the difference divided by the mean of two concentrations (see “Methods”). Black circles represent weighted average responses (proportion of visits to the higher sucrose concentration) over two presentations of the same pair of sucrose concentrations (Table 1), using number of visits as weights. The continuous curves represent the respective psychometric functions, and the dashed vertical lines indicate the psychometric function thresholds. The top three panels from left to right give data from three individually marked bumblebees. The bottom left panel gives the weighted average responses of marked bumblebees from both colonies that satisfied the minimum 800 visits per day criterion, but were not detected on a sufficient number of days for individual psychometric analysis. (Most of these data points are for single days only, rather than average values over 2 days.) The bottom middle panel gives the weighted average responses of all unmarked bumblebees from both colonies, and the bottom right panel gives the average responses (circles) and standard deviations (whiskers) calculated from pooling all data together (B20, B25, B30, miscellaneous, unmarked). The dashed curves in the bottom panels represent the psychometric function with parameters (lapse rate, threshold, and slope) averaged over the parameters of the three individually marked bumblebees
