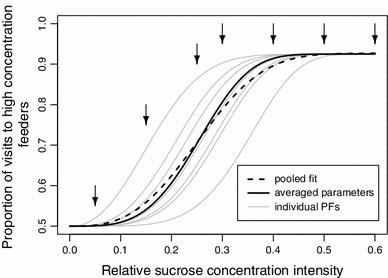
Fig. 4.

Data pooling can cause underestimation of the psychometric function slope. The figure illustrates with a theoretical example how the averaging of individual data changes psychometric function parameters. We start with 7 “individuals” represented by psychometric functions (PFs, gray lines) with different thresholds (mean ± SD: 0.25 ± 0.057), but equal lapse rates (0.15) and slopes (5). From the individual curves, we calculate the predicted discrimination performance values at relative intensities 0.05, 0.15, 0.25, 0.3, 0.4, 0.5, and 0.6 (arrows). We then average the predicted discrimination performances across animals using 200 visits per animal for each intensity value (N = 200 visits × 7 animals = 1,400 visits per relative intensity value) and apply the algorithm for psychometric function fitting by Kuss et al. (2005). We use a flat prior for the slope, in order to exclude potential confounding effects of the prior and select all remaining parameters as described in the “Methods” section. The resulting psychometric curve (dashed line) has a slope (±95 % CI) of 4.07 ± 0.67, significantly lower than the actual value of 5 that was identical for all individuals in the initial theoretical functions (p < 0.05). The estimates for the lapse rate (0.15 ± 0.02) and threshold (0.25 ± 0.01) do not differ from the average parameters. For comparison, the psychometric curve with parameters averaged across animals is also shown (continuous black line)
