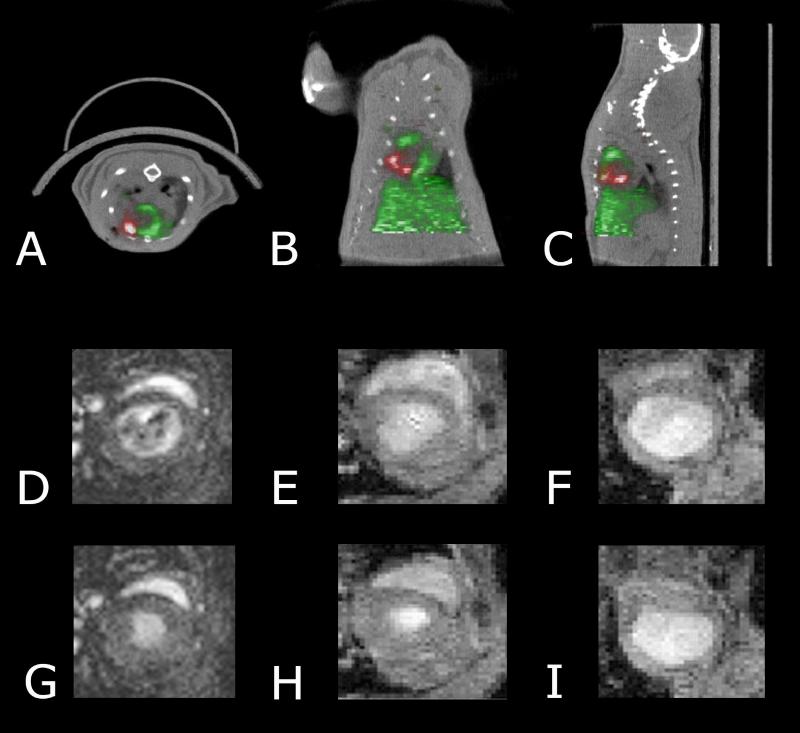
Figure 3. PET/CT and MRI imaging of stem cells.
Transverse (A), coronal (B), and sagittal (C) image orientations of the detection of intramyocardially injected 18F-FDG–labeled cardiac-derived stem cells (red) in rat heart (green) by small-animal PET/CT after ligation of mid left anterior descending coronary artery. PET was performed immediately after cell transplantation. Representative magnetic resonance images of normal mouse hearts (D&G), mouse embryonic stem cell transplanted hearts (E&H), and normal saline–treated hearts (F&I) shown in end-diastole (D-F) and end-systole (G-I) at 1 week after left anterior descending coronary artery ligation and cell transplantation. Reprinted with permission (Hendry et al. 2008; Wu et al. 2010).

