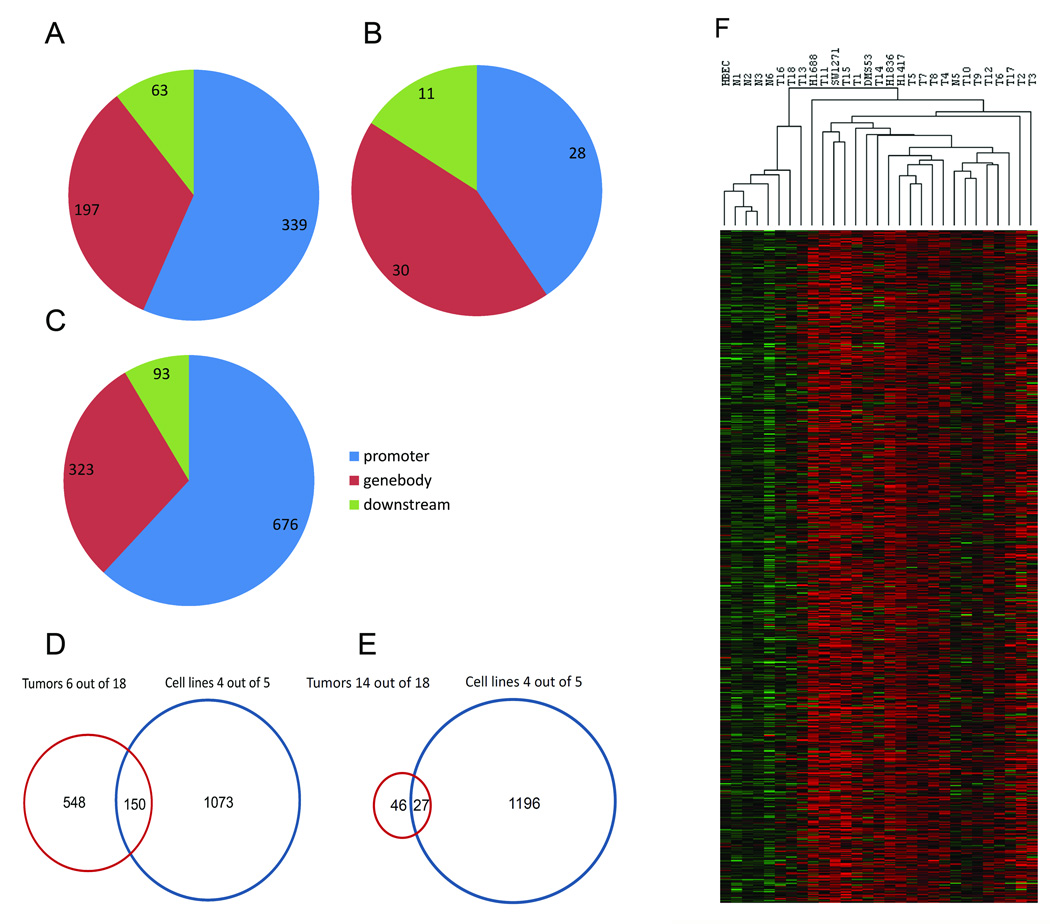
Figure 1. Mapping of tumor-specific methylation peaks in primary SCLC and SCLC cell lines.
A. Localization of the methylation peaks in primary SCLC (6 or more out of 18 tumors methylated; i.e. peaks that meet the minimum 80% quantile criterion in 6 of 18 tumors) relative to gene position. B. Localization of the methylation peaks in primary SCLC (14 or more out of 18 tumors methylated) relative to gene position. C. Localization of the methylation peaks in SCLC cell lines (4 or more out of 5 cell lines methylated) relative to gene position. D. Overlap of methylation peaks between SCLC primary tumors (6 or more out of 18 tumors methylated) and SCLC cell lines (4 or more out of 5 cell lines methylated). E. Overlap of methylation peaks between SCLC primary tumors (14 or more out of 18 tumors methylated) and SCLC cell lines (4 or more out of 5 cell lines methylated). F. Cluster analysis of methylation peaks. Methylation peaks found in at least 33% of tumor samples but not in normal samples were identified. Then the data were subjected to hierarchical clustering with Euclidean distance and average linkage method using Cluster v3.0 and visualized in Java TreeView. Red, methylated state; green, unmethylated state.

