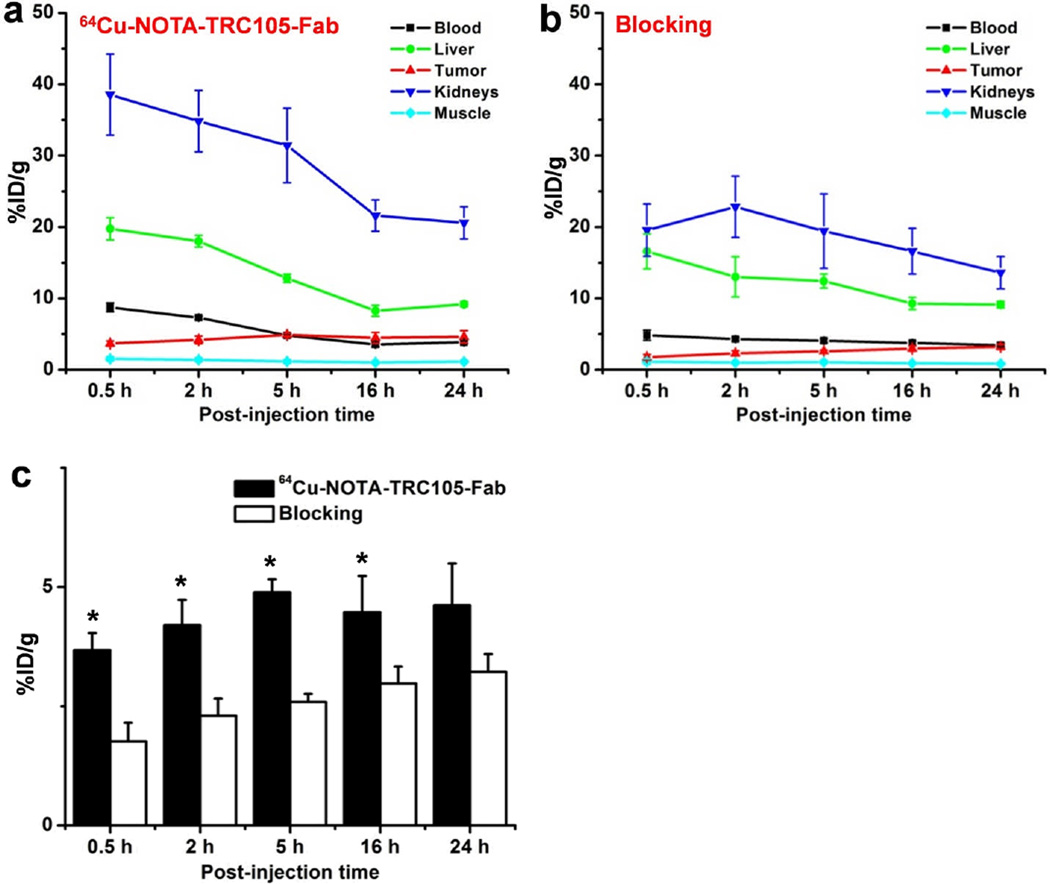
Fig. 4.
Quantitative analysis of the PET data. a Time-activity curves of the liver, 4T1 tumor, blood, kidney, and muscle upon intravenous injection of 64Cu-NOTA-TRC105-Fab. b Time-activity curves of the liver, 4T1 tumor, blood, kidney, and muscle upon intravenous injection of 64Cu-NOTA-TRC105-Fab, following a blocking dose of TRC105. c Comparison of tracer uptake in the 4T1 tumors between the two groups. n = 4; *, P < 0.05.

