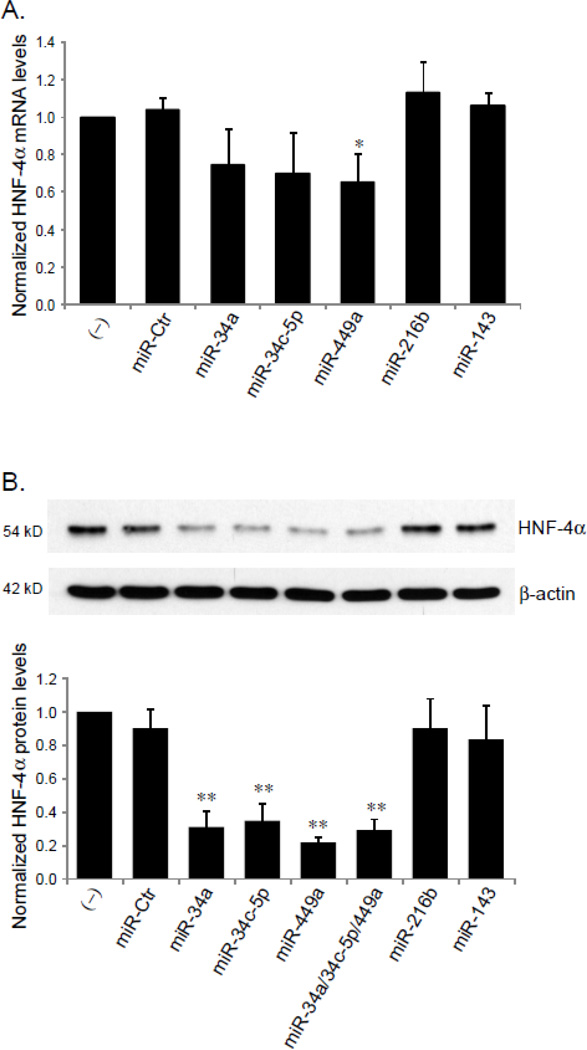
Fig. 4. The effect of miRNAs on HNF-4α expression.
HepG2 cells, seeded into 6-well plates, were transfected with 100 pmol of miRIDIAN miRNA mimics, negative control miRNA mimic (miR-Ctr) or were untreated (−). At 48 h or 72 h after transfection, mRNA and nuclear extracts were prepared, the expression levels of HNF-4α mRNA (A) and protein (B) were determined by RT-qPCR and Western blot, respectively. The bar graph in panel B summarizes the densitometric analyses of the effects of miRNAs on HNF-4α protein expression normalized by β-actin levels. The experiments were performed in triplicate, and presented as mean ± SD. *p<0.05 and **p<0.01 versus untreated control (−) or miR-Ctr.

