
Fig. 1. ATP induces cellular ROS through P2X7 receptor in GECs.


A. Generation of ROS in primary GECs after treatment with ATP measured using CM-H2DCFDA (DCF, a dye oxidized to green fluorescent by cellular H2O2) staining by cytofluorimetry at 24 h. High fluorescence population (right-shift of the green fluorescence distribution peak) indicates strong production of ROS upon ATP treatment at 24 h.
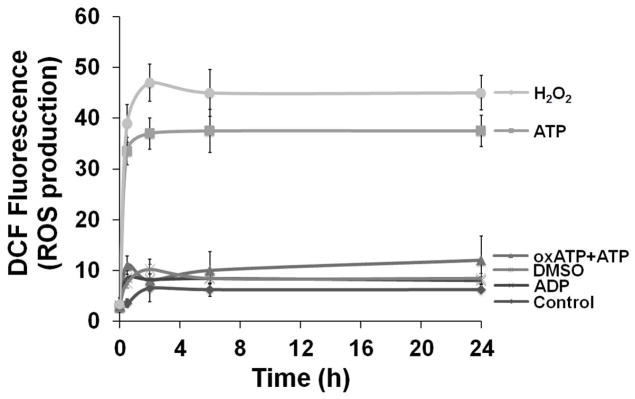
B. Kinetics of cellular ROS in living cells upon P2X7 agonist (3 mM ATP), antagonist (5 mM oxATP), and non-specific nucleotide (3 mM ADP) treatments were examined using DCF by fluorescence microscopy imaging combined with DIC during 24 h. The DIC verified the total number of cells in the samples.
C. The mean fluorescence intensities were determined by NIH-Image J analysis for 30 min, 2, 6, and 24 h time periods. The fluorescence intensity was normalized to the level of fluorescence recorded prior to stimulation with ATP. 100 μM H2O2 is used as positive control. 10 mM DMSO (diluent for DCF dye) was used to determine background control levels. The results are representative of at least 3 separate experiments performed in duplicate.