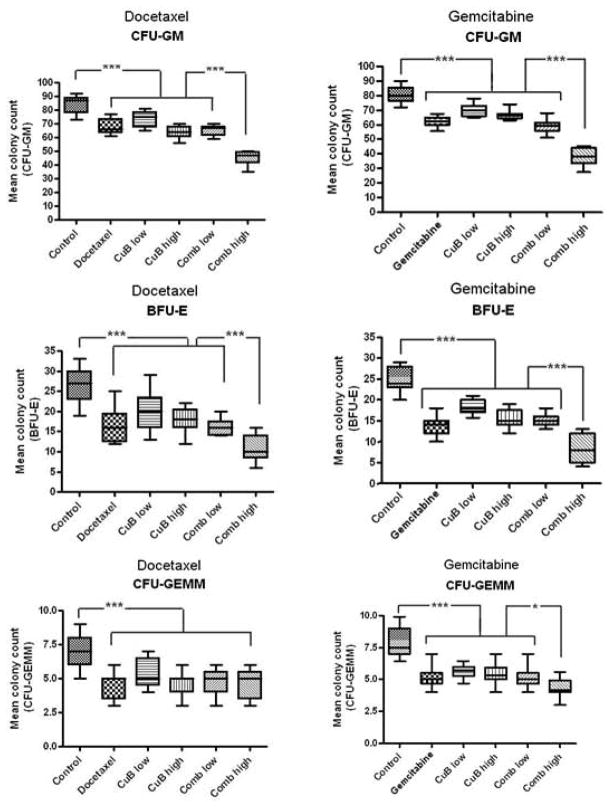
Figure 4. Analysis of bone marrow toxicity after drug treatment measured by clonogenic assays.
Bone marrow cells isolated from mice treated either with PBS (control), low dose CuB, high dose CuB, DOC, GEM, or combinations of either DOC or GEM with either low dose or high dose CuB (Comb low, Comb high, respectively; see Fig. 4 for in vivo treatment details, before harvest of bone marrow) were plated in triplicates in semi-solid methylcellulose medium. Box and whisker plots display mean colony counts +/−SD of CFU-GEMM, CFU-GM or BFU-E of three mice per treatment group. *, p < 0.05; **, p = 0.009; ***, p < 0.001.

