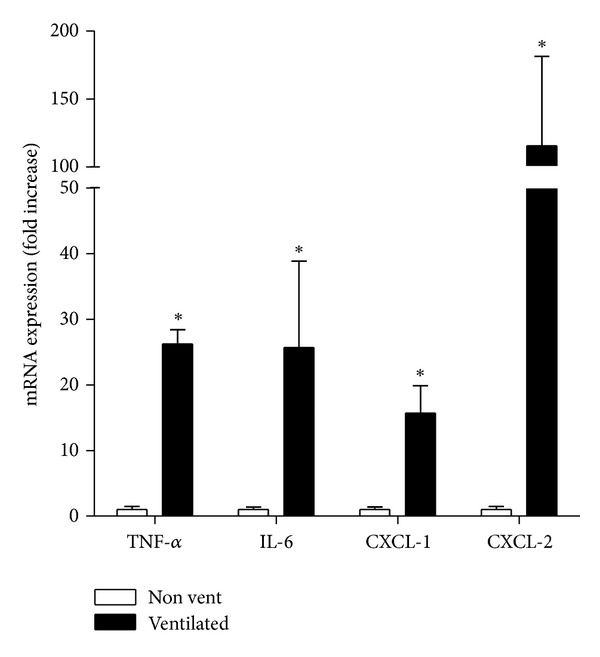
Figure 6.

Quantitative PCR for TNF-α, IL-6, CXCL-1, and CXCL-2 in liver tissues extracted from nonventilated (nonvent) and in vivo mechanically ventilated (ventilated) mice. Values represent fold-increase over expression in nonventilated mice. *P < 0.05 versus non-ventilated mice ±SEM.
