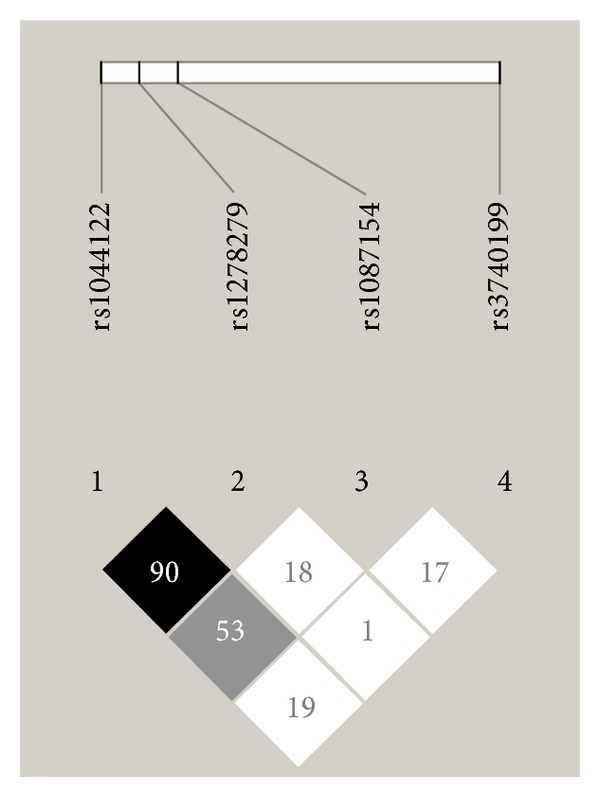
Figure 1.

The linkage disequilibrium (LD) across the ADAM12 gene. The results of LD mapping are generated using Haploview software. The values for D′ between each SNP are presented in each box. Black boxes denote strong LD (D′ > 80%), grey boxes denote weak LD (D′ 50–70%), and white boxes denote very weak or negligible LD (D′ < 50%).
