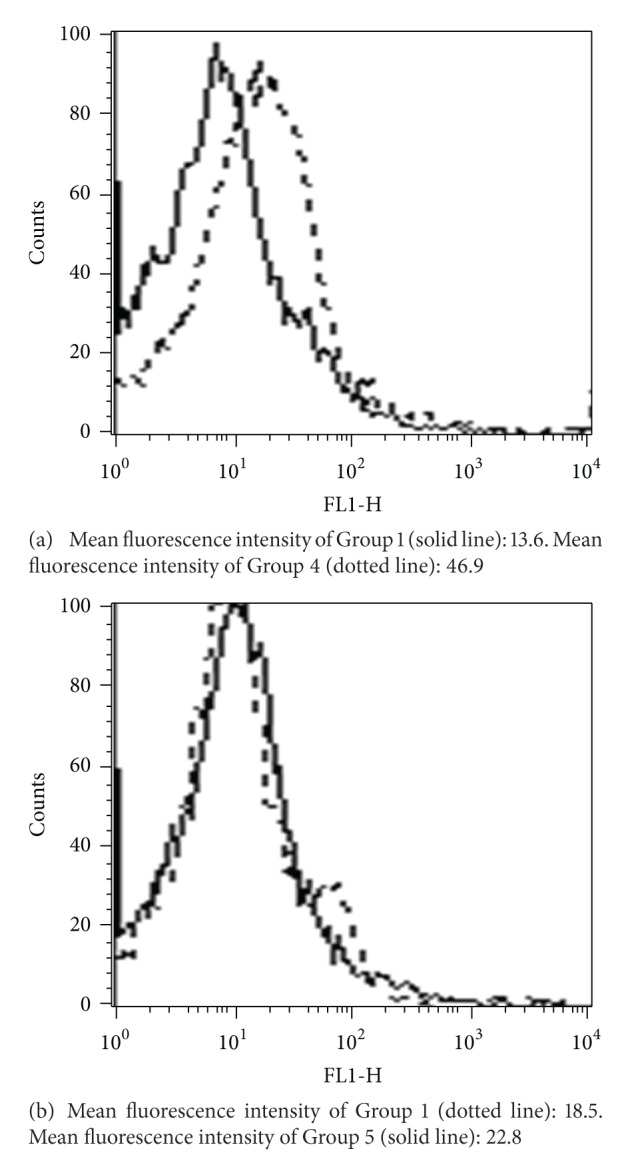
Figure 1.

Flow cytometric detection of ROS generation. (a) Group 1 animals that were untreated controls are compared with Group 4 animals that were dosed with 2000 mg/kg body wt. CQ. (b) Group 1 untreated controls were compared with Group 5 animals that were pretreated with quercetin 50 mg/Kg body wt. followed by 2000 mg/Kg body wt. dose of CQ. ROS generation was measured in terms of mean fluorescence intensity.
