Figure 11.

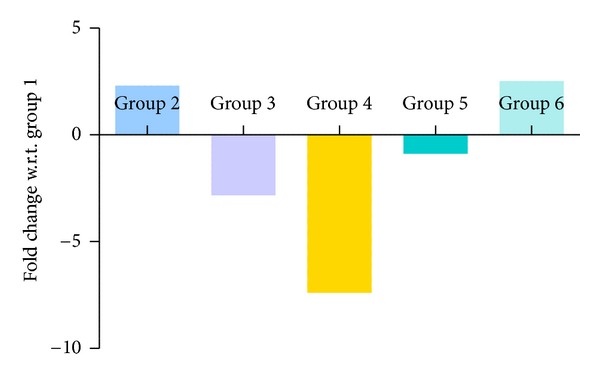
Quantitative PCR measurement of changes in mRNA transcript level of CAT gene. Values were indicative of difference in mRNA fold change of the treated groups with respect to untreated control of Group 1.

Quantitative PCR measurement of changes in mRNA transcript level of CAT gene. Values were indicative of difference in mRNA fold change of the treated groups with respect to untreated control of Group 1.