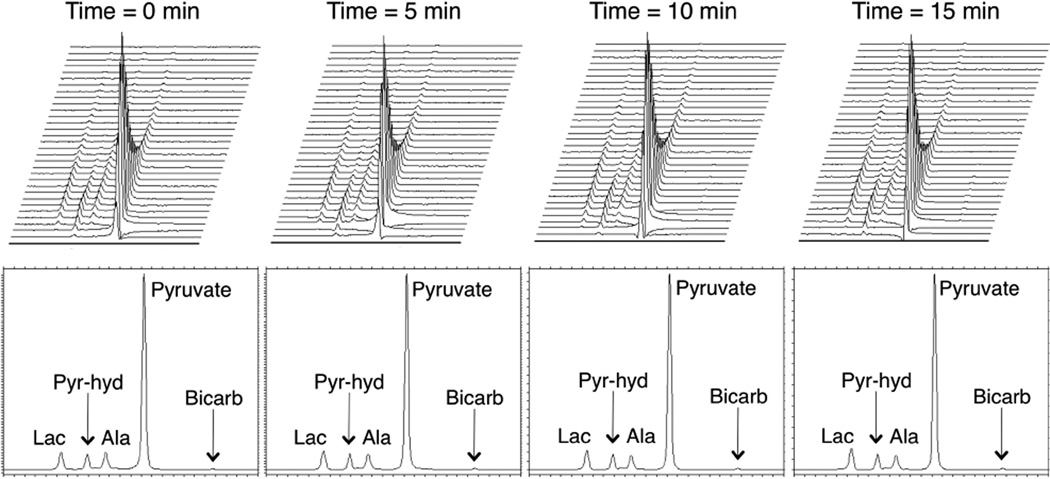
Figure 1.
Representative slab (top of liver to bladder) hyperpolarized dynamic MRS data from one rat at 0, 5, 10, and 15 minutes. The top row shows the dynamic time courses (32 dynamic time points, acquisition starting upon injection, span of 1 min and 36 sec), with the peaks from left to right being lactate (184.9 ppm), pyruvate-hydrate (181.0 ppm), alanine (178.4 ppm), and pyruvate (172.8 ppm). The bottom row shows the summation of each dynamic time course. Bicarbonate (162.7 ppm) was visible upon zooming into the summed spectra. Minimal temporal changes were detected over the 15 minutes of the 4 hyperpolarized injections.

