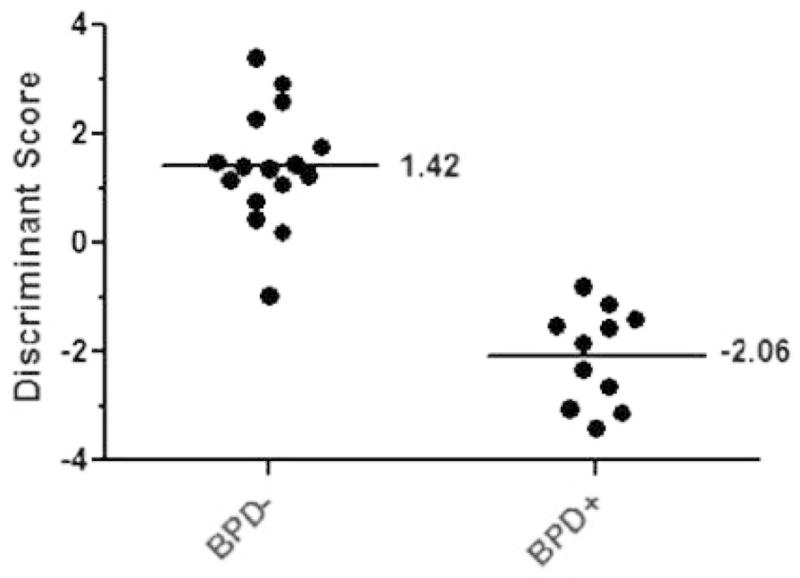
Figure 1.

Discriminant score scatter plot displaying the discriminant score for each patient in the study. Each dot corresponds to a patient’s discriminate score determined by the 12-predictor LDA function. On the X-axis the patients are grouped by clinical BPD diagnosis, which is plotted against their discriminative score on the Y-axis. The average discriminant score for patients without BPD (BPD−) was 1.42 and −2.06 for patients diagnosed with (BPD+).
