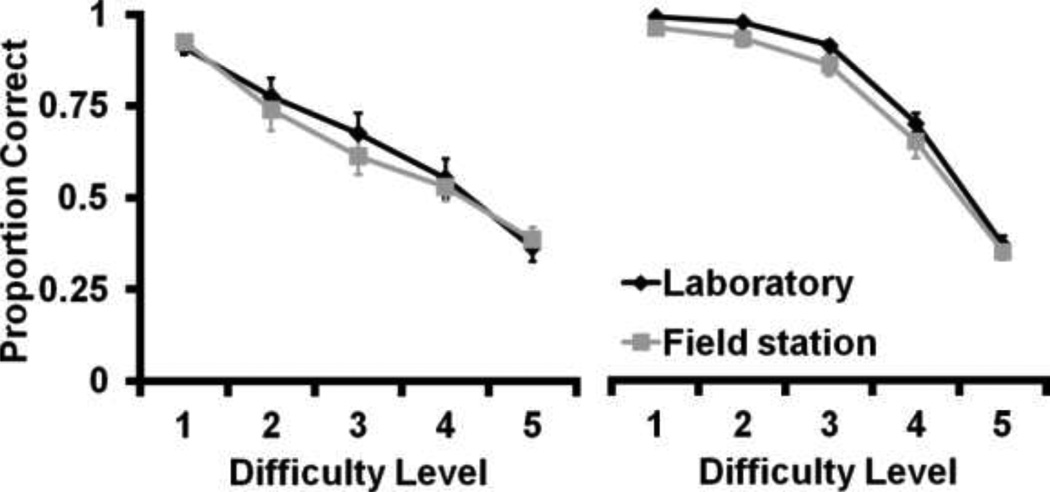
Fig 5.
Mean proportion correct on the two criterion sessions across the five discrimination difficulty levels in the size discrimination (left) and the brightness discrimination (right) by the Laboratory (black line) and Field station (grey line) groups. Error bars indicate ± standard error of the mean.

