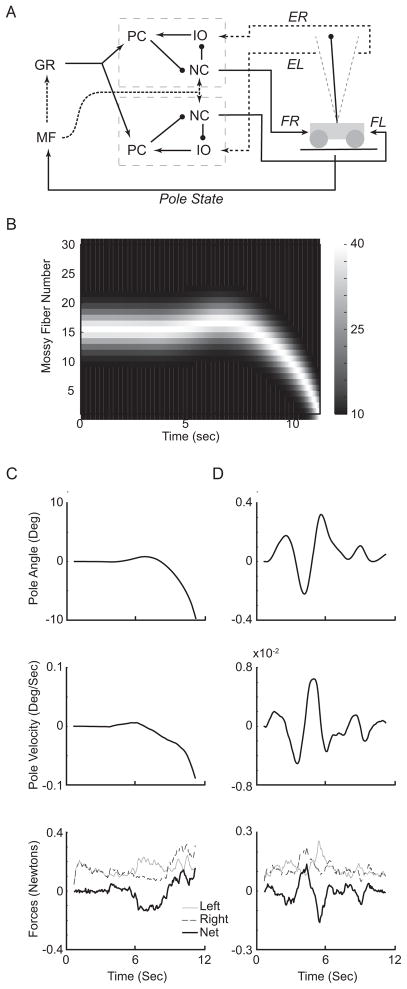
Figure 3. The simulation setup as applied to the cart-pole balancing problem.
A. Schematic of the simulation setup for cart-pole balancing. Information about the pole is encoded as mossy fiber inputs (MF). The mossy fibers indirectly connect to Purkinje cells (PC) through granule cells (GR). Unlike in eyelid conditioning, there are two sets of Purkinje cells, nucleus cells (NC), and inferior olivary cells (IO). The output of nucleus cells in each set is responsible for pushing the cart in one direction (FR: force right, FL: force left). When the pole exceeds certain position threshold (grey lines on either side of the pole), error signals (ER, error right, EL, error left) are sent to the associated inferior olivary cells. B. Pole angle population mossy fiber firing rate evolution over time for pole position of a failed train as in (C). Scale bar is in Hz. The mossy fibers shown are using the Gaussian encoding (see figure 4 and results). C. Evolution of pole states and simulation output over time for a single trial. Top: angle difference in degrees between the pole and upright. Positive is towards the left and negative is to the right. Middle: d(angle)/d(t) in degrees/second. Same signs as pole angle. Bottom: the output forces on the cart from the two output networks from the simulation. Left: force pushing the cart to the left, Right: force pushing the cart to the right, Net: the left and right forces are subtracted from each other to arrive at the actual net force acting on the cart. D. Same as in (C), for a successful trial. Note the difference in scales.

