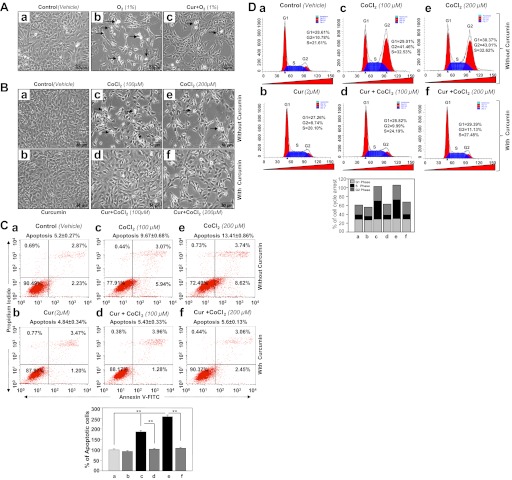
Fig. 3.
Curcumin treatment of HT22 cells attenuated apoptosis and released cell cycle arrest during hypoxic stress. A: photomicrograph of HT22 exposed to 1% O2 with or without curcumin treatment. Curcumin (2 μM) or DMSO vehicle-treated cells were placed inside hypoxic chamber to expose to 1% O2. Forty-eight hours later, photomicrographs were taken. Arrows denote rounded white and rounded dead cells (a: control; b: 1% O2; c: Cur + 1% O2). B: photomicrograph of HT22 exposed to CoCl2 with or without curcumin treatment. Curcumin (2 μM) or DMSO vehicle-treated cells were exposed to 100 or 200 μM of CoCl2. Forty-eight hours later, photomicrographs were taken. Arrows denote rounded white dead cells (a: control; b: Cur only; c: 100 μM CoCl2; d: Cur + 100 μM CoCl2; e: 200 μM CoCl2; f: Cur + 200 μM CoCl2). C: curcumin negatively regulated the vulnerability of HT22 cells to CoCl2-evoked apoptotic cells death. Cells untreated (a: vehicle control), treated with different concentration of CoCl2 alone (c: 100 μM; e: 200 μM) or pretreated with curcumin (b: 2 μM curcumin) followed by CoCl2 treatment (d: 100 μM; f: 200 μM). After 48 h of treatment, apoptosis was evaluated using annexin V-FITC/propidium iodide (PI) staining followed by flow cytometry. Top: representative plots showing annexin V-FITC/PI staining of HT22 cells. The proportion of late or apoptotic cells is shown. Bottom: histogram showing a significant increase of apoptotic cells (compare gray vs. black bars). Data represent means ± SD of 3 independent experiments. **P < 0.001. D: curcumin released CoCl2-induced S-phase and G2-M-phase cell cycle arrest in HT22 cells. Cells were cultured in 100-mm plate and treated with curcumin or DMSO (vehicle) for 12 h and then subjected to different concentrations of CoCl2. Cells were harvested and hypotonically lysed in a PI solution to stain the DNA. Nuclei were analyzed for DNA content by flow cytometry. a–f: same as in C. Percentage of cell population at the G1, S, and G2 phases is shown in histogram.

