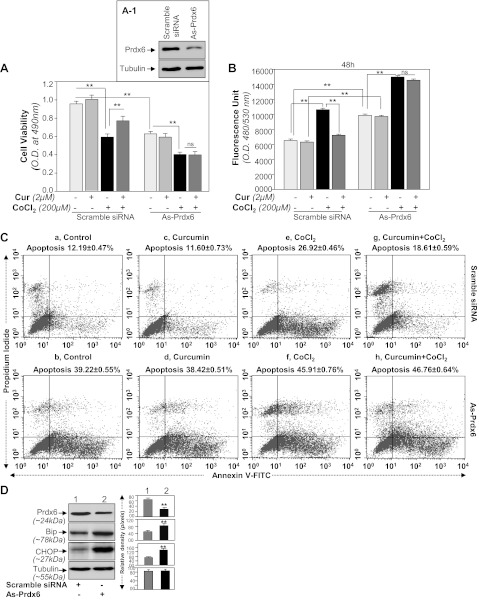
Fig. 7.
Prdx6 knockdown assay revealed that curcumin exerted its cytoprotective activity through Prdx6. A: MTS assay showing higher susceptibility of As-Prdx6-transfected cells to CoCl2 treatment. Cells were transfected with scramble siRNA or As-Prdx6 and processed for immunoblotting (inset A1). Cells were divided into predefined experimental group as shown, and then equal number of cells was cultured for assays to avoid transfection effect. Curcumin-treated or untreated HT22 cells were exposed to CoCl2. At different time intervals, MTS assay was conducted as described in materials and methods. Figure is representative of 48 h. A significant decrease in survival of As-Prdx6-transfected cells was observed compared with scramble control DNA-transfected cells, suggesting that Prdx6 is essential to protect cells from hypoxia-induced damage. B: H2-DCF-DA assay showing modulation in ROS levels in curcumin-treated or untreated As-Prdx6-transfected cells after CoCl2 treatment. Dye was added to the cells with or without CoCl2 treatment and fluorescent intensity was measured. C: scramble siRNA (a, c, e, and g) or As-Prdx6 (b, d, f, and h)-transfected HT22 cells were treated with curcumin followed by CoCl2 exposure. Forty-eight hours later, cells were analyzed for apoptosis using annexin V-FITC/PI staining following company's protocol (Apoptosis Detection Kit, BD Biosciences). Plots displaying annexin V-FITC/PI staining of control or As-Prdx6-transfected HT22 cells without (e and f) or with (g and h) curcumin treatment exposed to CoCl2. D: Prdx6 knockdown cells displayed prevalence of ER response. Western analysis showing reduced Prdx6 expression and increased expression of Bip and CHOP expression in As-Prdx6-transfected HT22 cells. Cells were cultured in 60-mm plates and transfected with As-Prdx6 for 48 h, cell lysates were prepared, proteins were resolved on 10% SDS-PAGE, and Western analysis was done. Membranes were striped/restriped and immunostained with antibodies as shown. Tubulin was used as an internal marker (D). Protein bands were quantified and presented as histograms. **P < 0.001, statistically significant difference.

