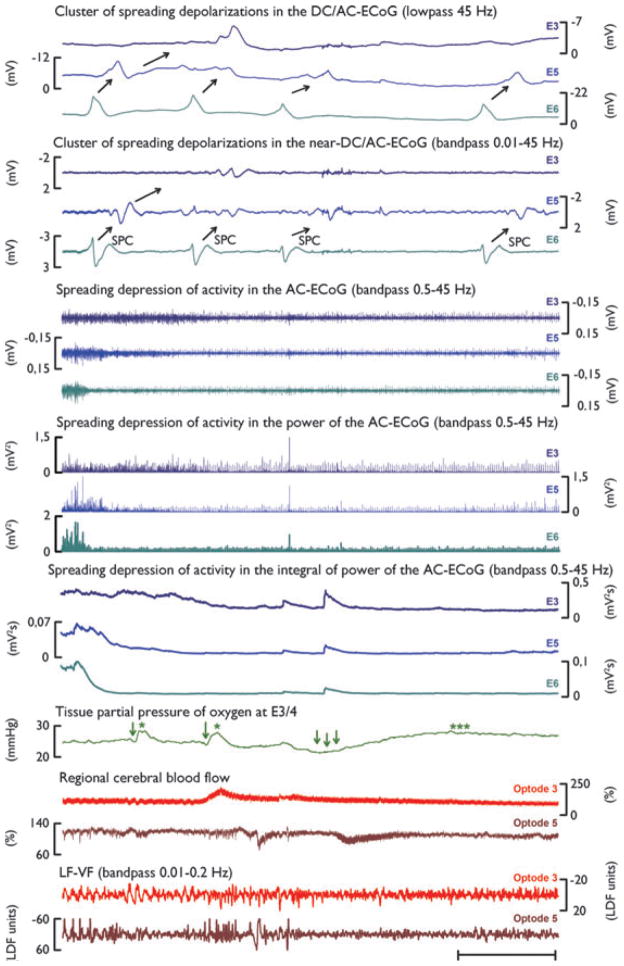
Figure 1.
Cluster of SDs over a period of 1 h on day 4 after aSAH. Traces 1–3 show the monopolar recordings of the DC-ECoG at electrodes 3, 5, and 6 in the frequency range below 45 Hz. Four SDs, identified by large, negative slow potential changes (SPCs) propagate from electrode 6 (E6) to electrodes 5 and 3 (E5, E3) (direction of propagation indicated by black arrows). Traces 4–6 show the parallel monopolar recordings of the near DC/AC-ECoG at electrodes 3, 5, and 6 in the frequency range between 0.01 and 45 Hz. Here again, black arrows point into the direction of propagation of the SDs. In the high-frequency, alternating current range of the ECoG (bandwidth 0.5–45 Hz), SD causes silencing of spontaneous activity, that is, spreading depression. This is observed as a rapid reduction in ECoG power. Traces 7–9 display the bandpass filtered ECoG recorded at electrodes 3, 5, and 6. The integral of power of the high frequency signal (traces 13–15) is used for visual enhancement of the amplitude loss and helps to determine the duration of the depression period beginning at the initial decrease and ending at the start of the recovery, as described previously (Dreier et al., 2006). Note that the spreading depression of spontaneous activity propagates in a similar fashion as the SPCs from E6 to E3. Trace 16 displays changes in ptiO2, measured with the intraparenchymal oxygen sensor (see Methods section). Note that the first two SDs have essentially hyperoxic responses (green single asterisks, mild hypoxia indicated by green single arrows). The third SD causes a profound hypoxic response (triple arrows) followed by hyperoxia (triple asterisks). Optode 3 (trace 17) shows a hyperemic response to the SD recorded at electrode 3, whereas optode 5 displays a clearly hypoemic response to the third SD. This is coincident with the ptiO2 response described above. Note, however, that there is a delay in rCBF decrease after ptiO2 decrease. This is likely due to the spatial distance between the Licox probe (located between electrodes 3 and 4) and optode 5 (located near electrode 5).

