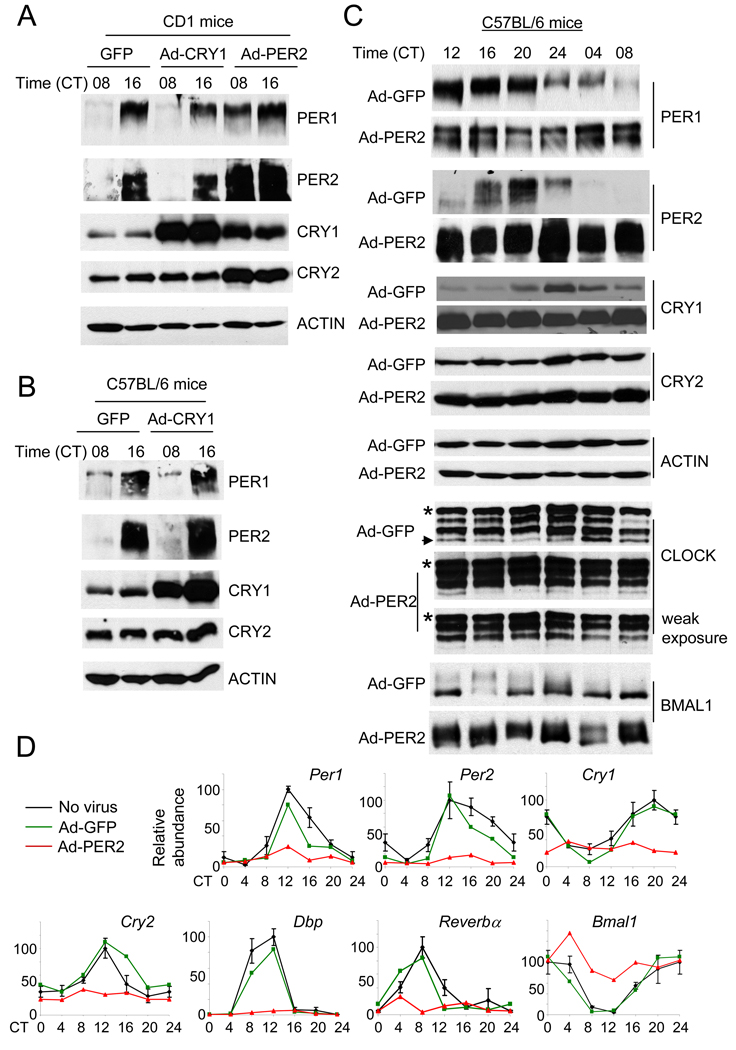
Fig. 3.
Constitutive expression of GFP, CRY1 or PER2 in mouse liver produced similar results as in MEFs. (A) (B) (C) CD-1 (A) and C57BL/6 (B and C) strains were injected with adenovirus expressing GFP, CRY1 or PER2 and sacrificed at the indicated circadian times. Liver extracts were subjected to immunoblotting. Results are representative of at least 2 mice per time point. * indicates a nonspecific band in the CLOCK immunoblot. The arrow indicates a hypophosphorylated isoform, which is much weaker in PER2-liver. Note that the top isoform is much more enriched in the PER2-liver. (D) Quantification of mRNA levels of clock and clock-controlled genes in control (no virus, black), GFP (green)-, and PER2 (red)-liver. mRNA levels were measured by quantitative real-time PCR. Results are average+/−SEM of three mice for controls, and representative of two mice per time point for GFP and PER2-adenovirus injected mice. The data for the second set of the GFP and PER2 mice are shown in Suppl Fig 6. Levels were normalized so that the highest levels of the control mice equaled 100 arbitrary units. The CT 0 data were plotted twice as CT 0 and 24.

