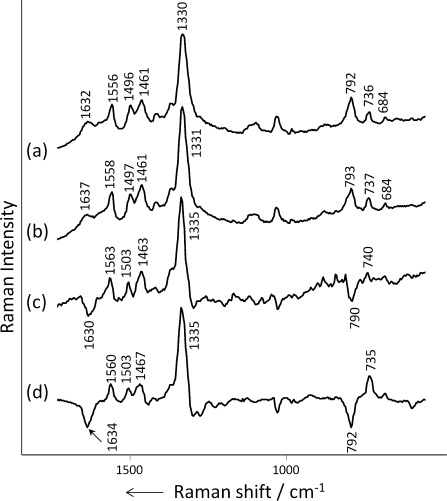
Figure 4.

SERS spectra of a) DNA-4 and b) DNA-5. c) Simple difference spectrum of DNA-5 minus DNA-4 ((b)−(a)) shown with its intensity expanded eight times. d) Model difference spectrum, poly A minus poly C. All spectra are for hydroxylamine-reduced Ag colloids aggregated with 0.1 m MgSO4.
