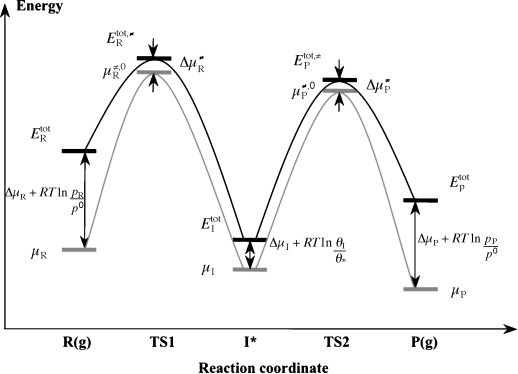
Figure 1.

Energy diagram of a model for heterogeneous catalytic reactions. The black curve stands for the profile of total energies calculated from DFT, and the gray curve represents the profile of chemical potentials. TS1 and TS2 are the transition states (TSs) of adsorption and desorption, respectively. Etot is the total energy, and µ is the chemical potential (subscript R, I and P refer to reactant, intermediate, and product).  and
and  are the total energy and standard chemical potential of the TS of adsorption, respectively,
  and
and  have the same meanings for the TS of desorption. The correction of the chemical potential because of the temperature effect is given by Δµ. The thermal corrections for gaseous molecules (ΔµR and ΔµP) are quite large because of large entropy effects, whereas the corrections for surface species (
 , ΔµI and
  ) are much smaller. R
Tln(θi/θ*) is the coverage-dependent term in the expression of the chemical potential of surface species [see Eq. (1)], and likewise R
Tln(p/po) is the pressure-dependent term for gaseous molecules [see Eq. (S1) in the Supporting Information]. Unlike intermediate state, the standard chemical potentials for the TSs appear in the profile of chemical potentials.
