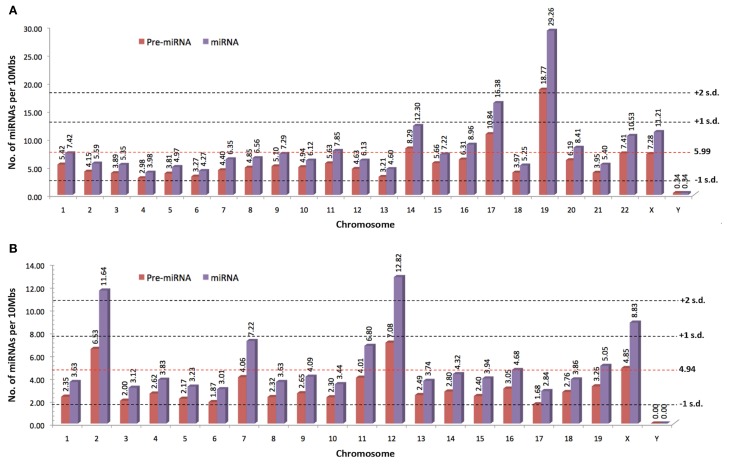
Figure 2.
The normalized number of precursor and mature miRNAs per 10 Mbs indexed by miRBase for (A) human and (B) mouse (www.miRBase.org; miRBase v19 accessed on 8/11/2012). Red-dotted horizontal lines denote the average mature miRNAs per 10Mbs across the genome. Gray-dotted horizontal lines denote the number of standard deviation (SD) from the global average value.

