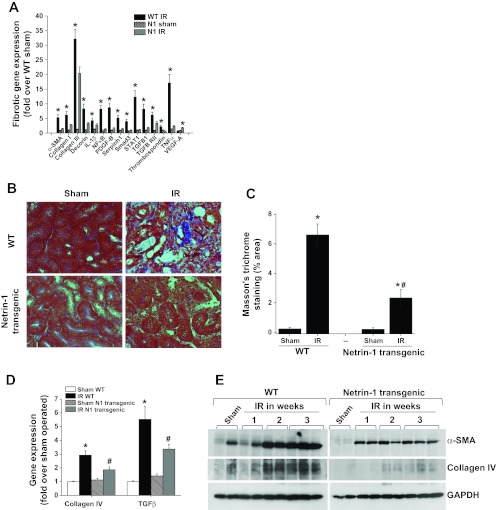
Fig. 3.
IR-induced fibrosis is suppressed in netrin-1 transgenic mice. Fibrotic gene expression was determined by real-time PCR, and fibrosis was determined using Masson's trichrome staining. Extent of fibrosis was calculated as percent stained area in the ×40 field. A: IR-induced profibrotic gene expression was suppressed with netrin-1 overexpression in the proximal tubular epithelial cells. *P < 0.05 vs. all other groups. B: Masson's trichrome staining shows fibrosis (blue color) in WT mice with IR, which was reduced in netrin-1 transgenic animals subjected to IR. C: quantification of fibrosis. Netrin-1 overexpression significantly reduced the extent of fibrosis. *P < 0.001 vs. sham. #P < 0.001 vs. WT IR. D: fibrotic gene expression after IR in WT and netrin-1 transgenic animals compared with sham surgery. *P < 0.05 vs. sham. #P < 0.05 vs. WT IR; n = 4–6. E: Western blot analysis of α-smooth muscle actin (α-SMA) and collage IV expression after IR in WT and netrin-1 transgenic mouse kidney; n = 4.

