Fig. 1.
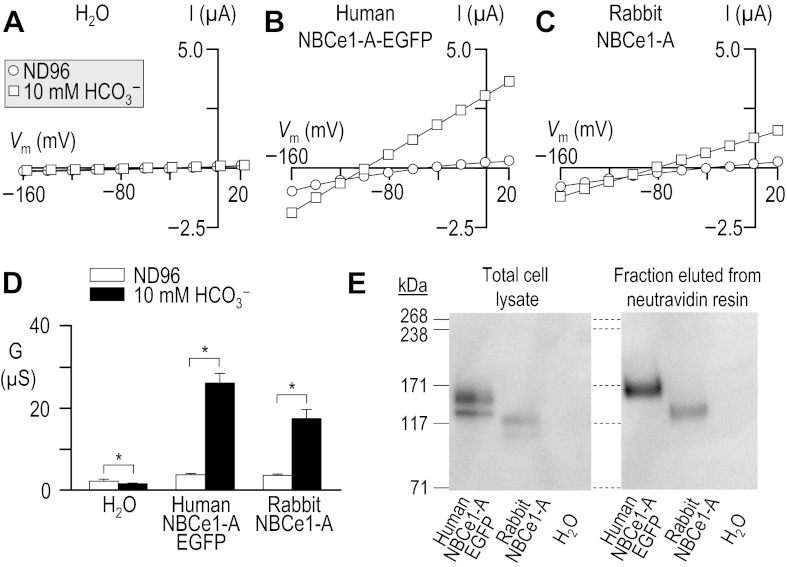
Influence of HCO3− upon current-voltage (I-V) relationships for human vs. rabbit electrogenic sodium/bicarbonate cotransporter 1-A (NBCe1-A). Oocytes were injected with either H2O (A), cRNA encoding human NBCe1-A-EGFP (B), or cRNA encoding rabbit NBCe1-A (C). I-V relationships were obtained by voltage clamp while the cells were sequentially exposed to the nominally CO2/HCO3−-free solution, ND96 and to our 10-mM HCO3− solution. Note that the squares in A are artificially offset by +3 mV from the circles to make both data sets visible. Averaged slope conductances (G) measured between −20 and +20 mV for 6 cells are shown in D, in which the results of paired one-tailed t-tests are shown as horizontal bars (*P < 0.05). A representative Western blot analysis of total (left) and biotinylated (right) NBCe1 protein from oocytes similar to those assayed in A–D is shown in E, detected using an anti-NBCe1 antibody. The composition of solutions used in this protocol is shown in Table 1.

