Fig. 6.
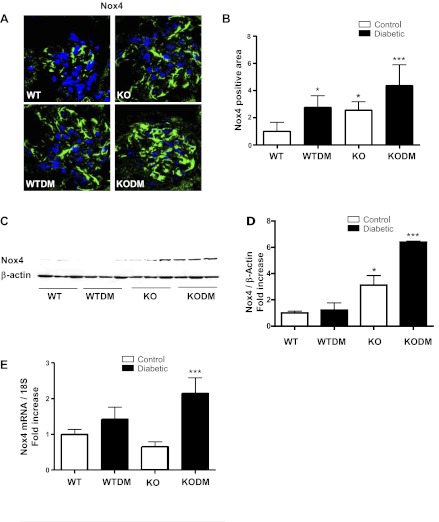
Expression of Nox4 was increased in diabetic Nox2 KO mice. A: immunofluorescence imaging with anti-Nox4 antibody was performed on frozen sections from mice after 8 wk of diabetes. Sections were visualized by confocal microscopy. Original magnification, ×63. B: quantification of glomerular protein (green) pixel density divided by glomerular area is shown. Data are expressed as fold induction (4 images per mouse, 3 mice/group). The protein levels of Nox4 were analyzed by Western blot analysis (C) and quantitative analysis (D) of Nox4 protein levels and Nox4 gene expression (E) by quantitative RT-PCR in the kidney cortex after 20 wk of diabetes. Values are group means ± SE; n = 3 for each group. *P < 0.05 vs. WT. ***P < 0.05 vs. all other groups.

