
Figure 1.
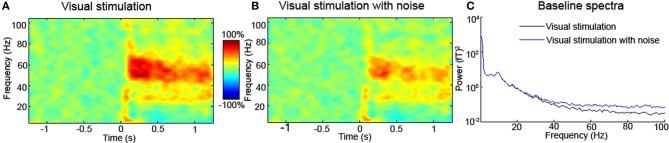
(A) Typical MEG source-level time-frequency response of a single participant to visual stimulation with a square-wave grating stimulus (data from Muthukumaraswamy et al., 2013). Equivalent EEG data look very similar (Muthukumaraswamy and Singh, 2013). In the time-frequency spectrum presented in (B), white noise has been added to the channel prior to computation of the time-frequency response. The high-frequency response around 60 Hz is clearly attenuated in the presence of white noise, which similar to muscle activity has a broad bandwidth. Similar to this artificial addition of simulated noise, any experimental intervention (or use of different participant groups) that modulates baseline noise levels may appear to alter the induced high-frequency response. Units are percentage change from the pre-stimulus baseline for both (A and B). In (C) the baseline spectra (–1.2 to 0 s) are plotted for the original and original+ white noise channels. Inspection of these spectra reveals that high-frequency components are easily affected by noise. This broadband-added noise is similar to what might happen in the presence or absence of muscle artifacts. When differences in high-frequency are reported between interventions/participants/groups, comparison of the baseline spectra should be performed. Differences in the baseline may reflect artifactual or neural sources.