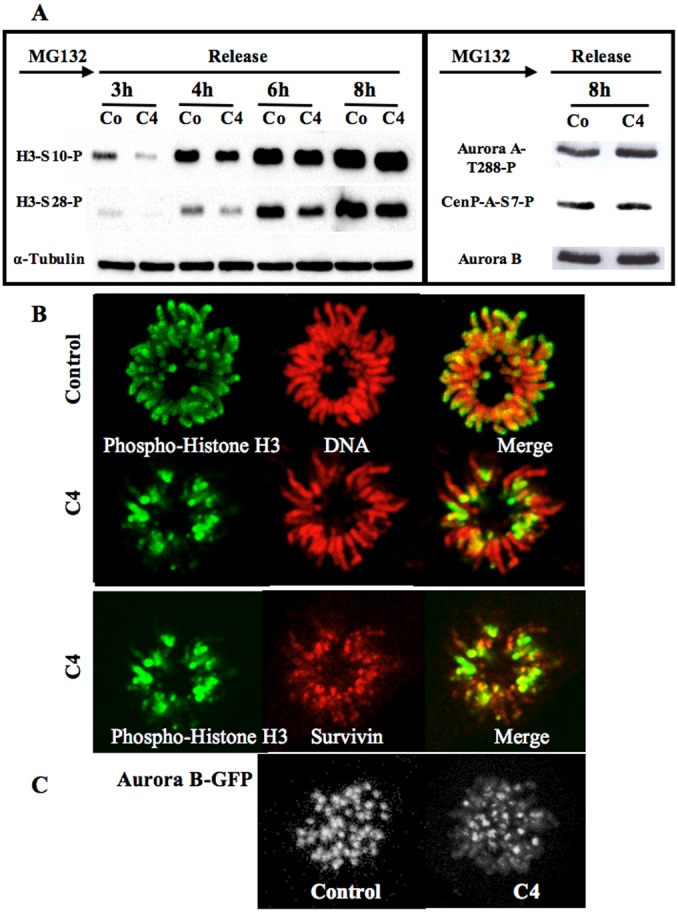
Fig. 2. Histone H3 phosphorylation appears at prometaphase upon C4 treatment.

(A) Western blots were realized on cells synchronized at mitotic entry in the presence of MG-132 and then released for varying times. Histone H3 (Ser10 and Ser 28) phosphorylations were analyzed in control (Co) and C4 treated cells (C4). The same membrane was also revealed using an antibody against α-tubulin for estimation of the amount of cells. The signals were quantified and the results are in supplementary material Table S1. The phosphorylations of Cenp-A (Ser 7) and aurora kinase A (Thr 288) are also shown in control (Co) and C4 treated cells (C4). Aurora kinase B detection is used for estimation of the amount of mitotic cells. Its level was quantified using α-tubulin as internal standard (supplementary material Table S1; Fig. S2). (B) Detection of histone H3 (Ser10) phosphorylation on control and C4 treated cells. Phospho-histone H3 is in green and DNA in red. On the same C4-treated cells, the histone H3 (Ser10) phosphorylation signal (in green) colocalized with survivin (represented in red). (C) Detection of aurora kinase B on prometaphasic cells. Z stacks were imaged and 3D-projections are shown. The settings were kept identical for both conditions.
