
Fig. 3. Time lapse on mitotic cells.
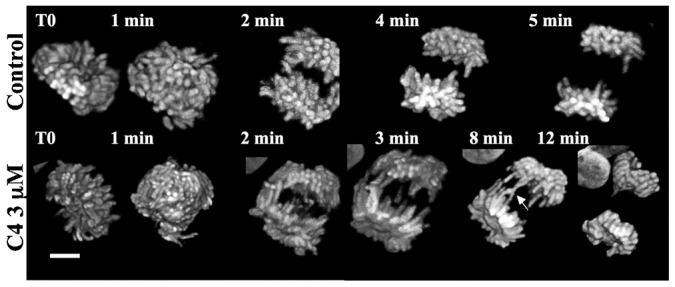
Mitotic Hek stably expressing histone H2A-GFP were continuously imaged. Z stacks were acquired and 3D-projections are shown. The settings were kept identical for all conditions. Representative control and C4 treated cells are shown and elapse times indicated on each image. Scale bar: 5 µm.