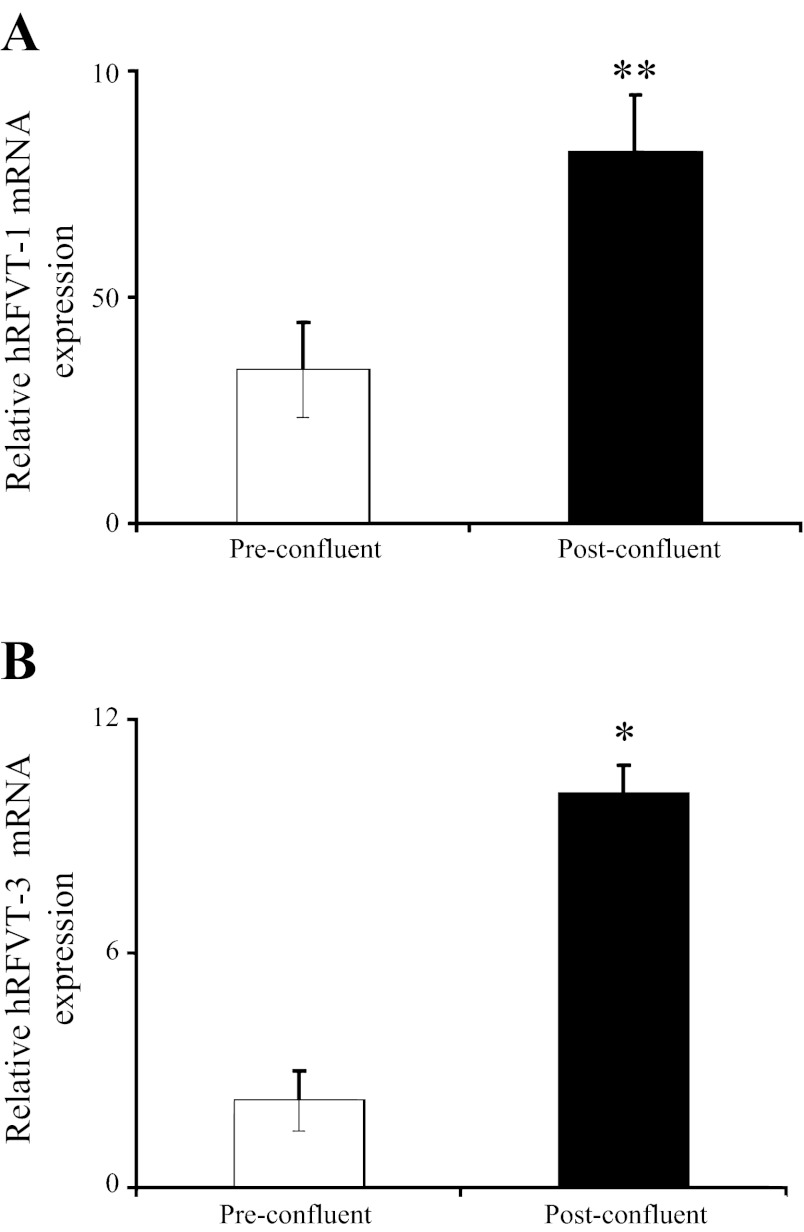
Fig. 3.
Level of expression of hRFVT-1 and hRFVT-3 mRNA in pre- and postconfluent Caco-2 cells. Real-time PCR was performed using hRFVT-1 (A) and hRFVT-3 (B) gene-specific primers and total RNA (5 μg) from pre- and postconfluent Caco-2 cells. Values are means ± SE from ≥3 independent sets of experiments from different batches of cells and were performed on different occasions. *P < 0.01, **P < 0.05.

