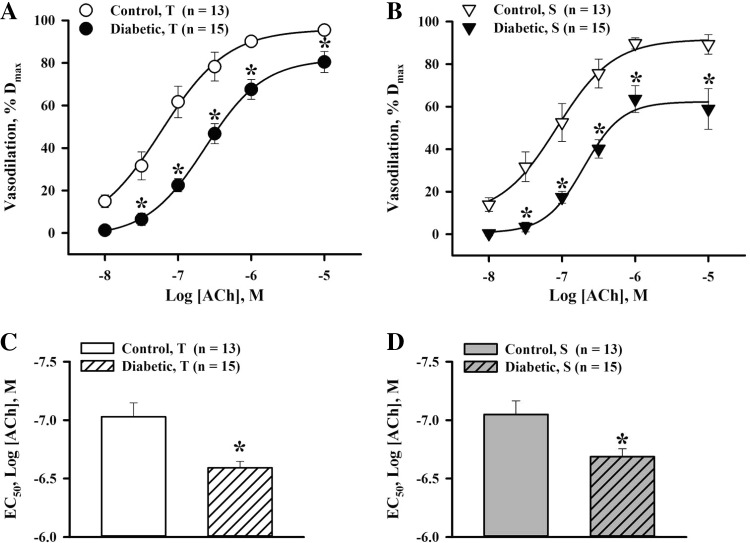
Fig. 2.
Decreased vasodilator responsiveness and sensitivity to ACh in uteroplacental arteries of diabetic pregnant rats. A and B: summary graphs showing the degree of T and S vasodilation as a function of ACh concentrations in arteries from control and diabetic rats. ACh-induced vasodilation is expressed as Dmax. *Significantly different compared with the respective control group at P < 0.05 (by two-way repeated-measures ANOVA). C and D: bar graphs showing the significant increase in the concentration of ACh required for half-maximal T and S dilatation (EC50) of uterine arteries of diabetic rats [−6.69 ± 0.05 and −6.67 ± 0.07 log(ACh); in M] compared with control rats [−7.03 ± 0.12 and −7.05 ± 0.12 log(ACh), in M]. *Significantly different compared with the respective control group at P < 0.05 (by unpaired Student's t-test). Numbers in parentheses indicate the numbers of arteries tested.

