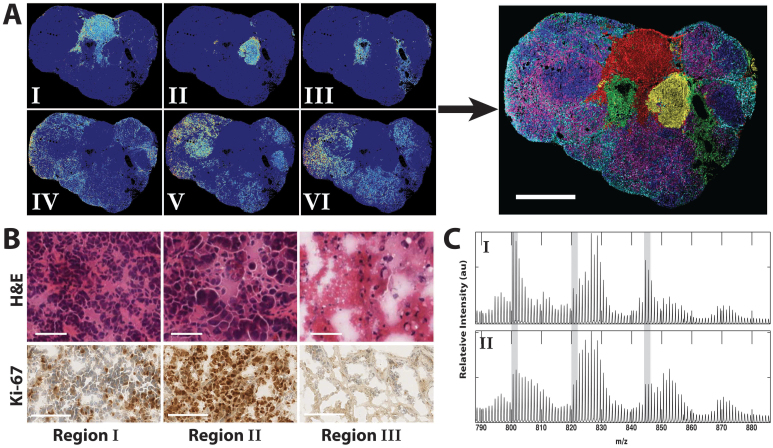
Figure 4.
(A) Spatial distribution of clustered pixels for each K-means region attributed to the tumor phospholipids shown as individual images (left) and a merged overlay (right) with colors corresponding to the following regions: I-red, II-green, III-cyan, IV-yellow, V-blue, VI-purple.Scale bar, 5 mm. (B) H&E and Ki-67 stains corresponding to K-means regions I – III. Scale bars, 50 μm (H&E) and 100 μm (Ki-67). (C) Average spectra corresponding to K-means region I and II identified in the 2H-labeled tumor. Highlighted in gray are 3 areas that show different degrees of labeling for the same lipid between region I and II. This can be ascertained by visual inspection of the relative peak heights between adjacent peaks.

