
Fig. 5.
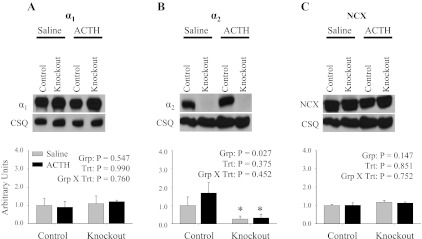
Expression profile of the α1- and α2-isoforms of the Na,K-ATPase and NCX following ACTH treatment. Representative immunoblots and relative protein expression in heart microsomes of α1 (A), α2 (B), and NCX (C) following 3 days of ACTH treatment are shown. Relative protein expression was determined by densitometry and normalized to the abundance of CSQ. The data represent a relative ratio of protein expression to that of saline control. The data were obtained from 3 independent experiments and are displayed as arbitrary units ± SE, n = 3. Main effects and interactions from 2-way ANOVA are shown in each panel. Post hoc comparisons were as follows: *P < 0.05 compared with control.