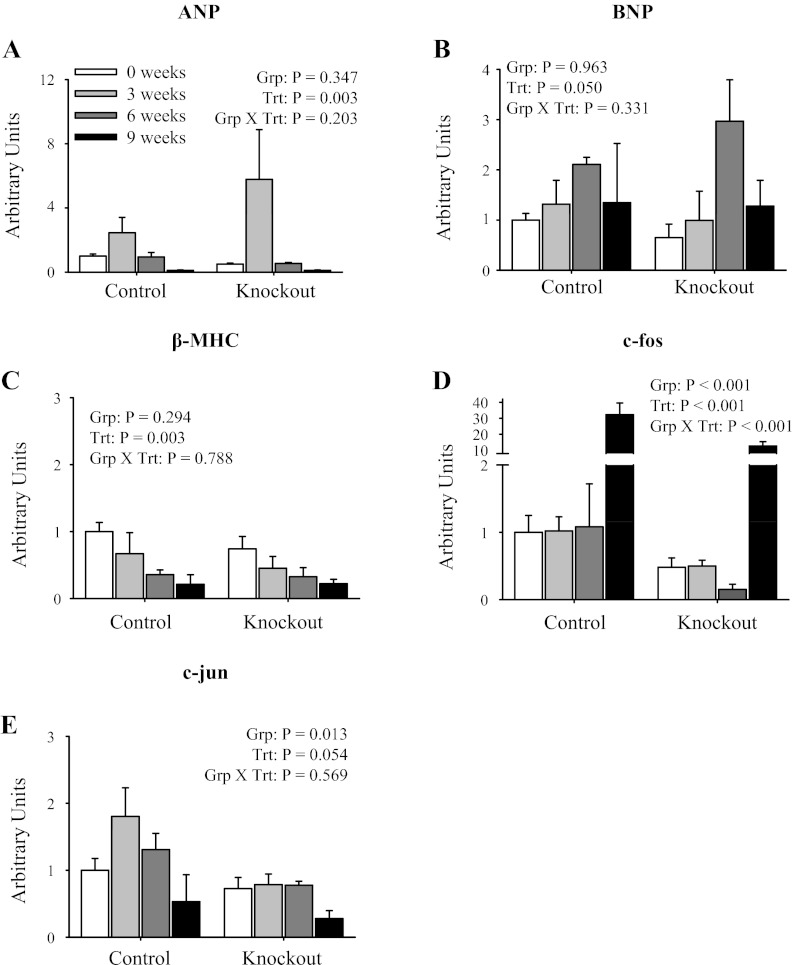
Fig. 7.
mRNA expression profile of cardiac hypertrophy markers in isolated ventricles following TAC. Quantitative real-time PCR analysis of mRNA expression of atrial natriuretic peptide (ANP; A), brain natriuretic peptide (BNP; B), β-MHC (C), c-fos (D), and c-jun (E) normalized to GAPDH expression is shown. Data were collected from mice at 0 (sham), 3, 6, and 9 wk post-TAC surgery. The data represent a relative ratio of mRNA expression to that of the 0-wk control. Values represent means ± SE; n = 4. Main effects and interactions from 2-way ANOVA are shown in each panel.

