
Fig. 8.
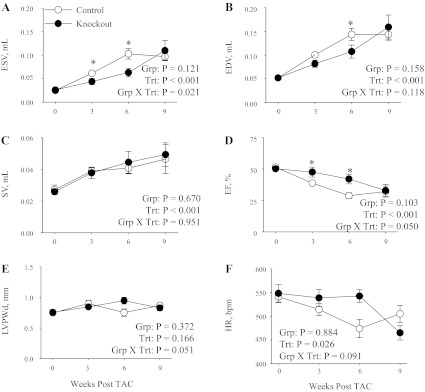
Echocardiography in control and knockout mice following transaortic constriction. Echocardiographic measurements for end-systolic volume (ESV; A), end-diastolic volume (EDV; B), stroke volume (SV; C), ejection fraction (EF; D), left ventricular posterior wall thickness during diastole (LVPWd; E), and heart rate (HR; F) were made in control (n = 9) and knockout (n = 9) mice. Data were collected at baseline (0) and 3, 6, and 9 wk post-TAC surgery. Values represent means ± SE. Main effects and interactions from 2-way repeated-measures ANOVA are shown in each panel. Post hoc comparisons were as follows: *P < 0.05 compared with control.