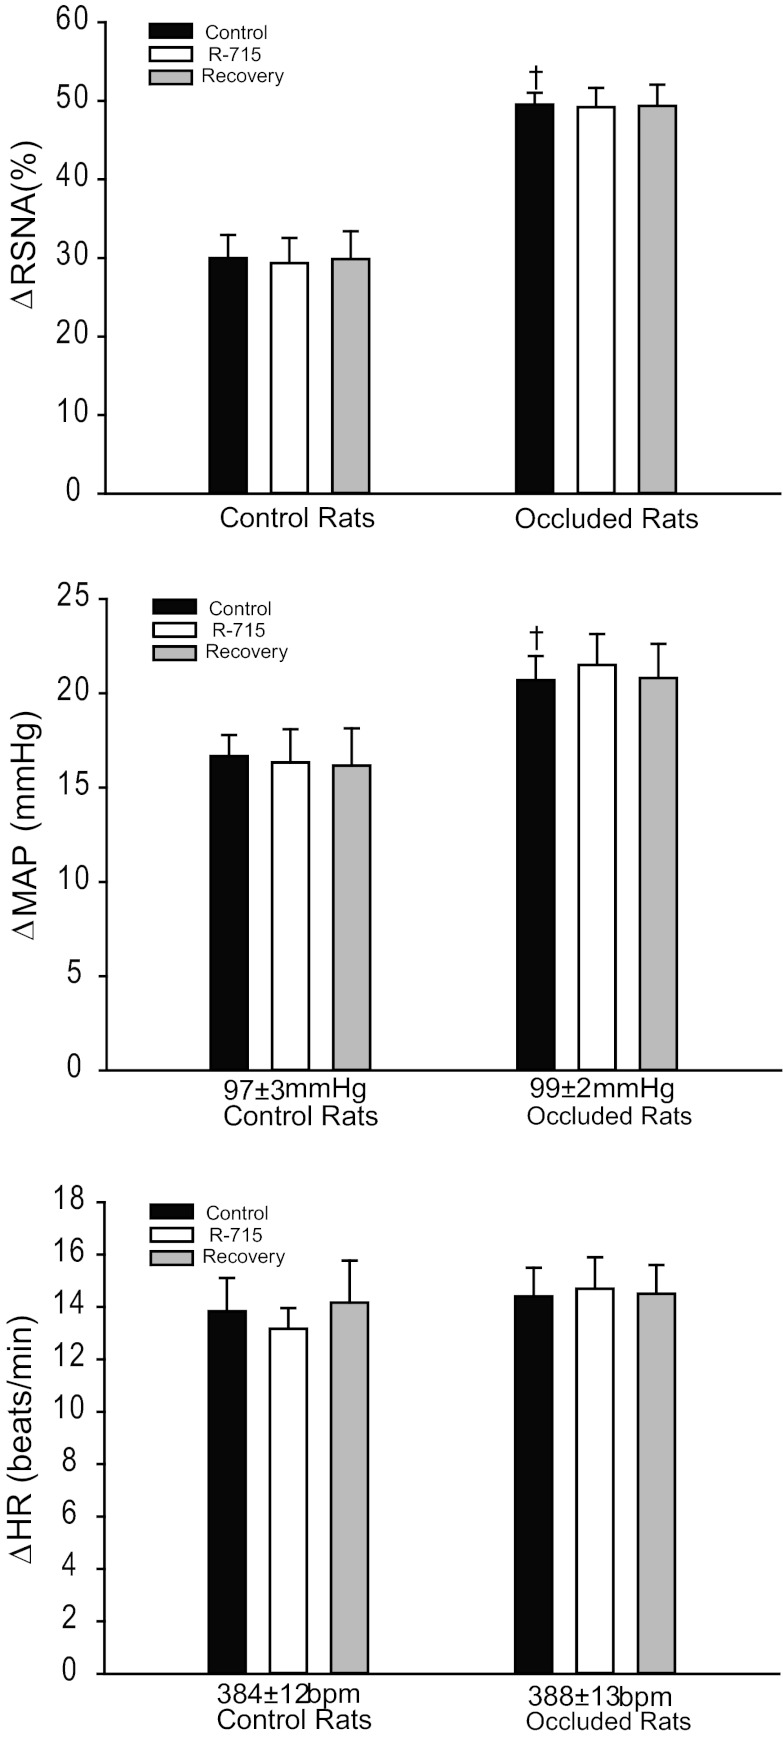
Fig. 5.
The changes of RSNA, MAP, and HR were measured in response to muscle stretch after B1 receptor inhibition by R-715. Average data show that 24 h of femoral artery occlusion significantly increased the responses of RSNA and MAP evoked by muscle stretch with 0.5 kg of muscle tension. Blocking B1 receptors did not significantly influence RSNA, MAP, and HR responses to muscle stretch in control and ligated groups. Both control and ligated groups displayed very little changes in overall RSNA, MAP, and HR responses after inhibition of B1 receptor. †P < 0.05, significant differences in changes in RSNA and MAP between control group and ligated group. The number of animals is 10 in each group. Note that the same level of tension was loaded in 3 interventions. Also, there were no differences in S/N ratio for the basal RSNA in control rats (3.6 ± 0.4) and ligated rats (3.4 ± 0.4, P > 0.05 vs. control).

