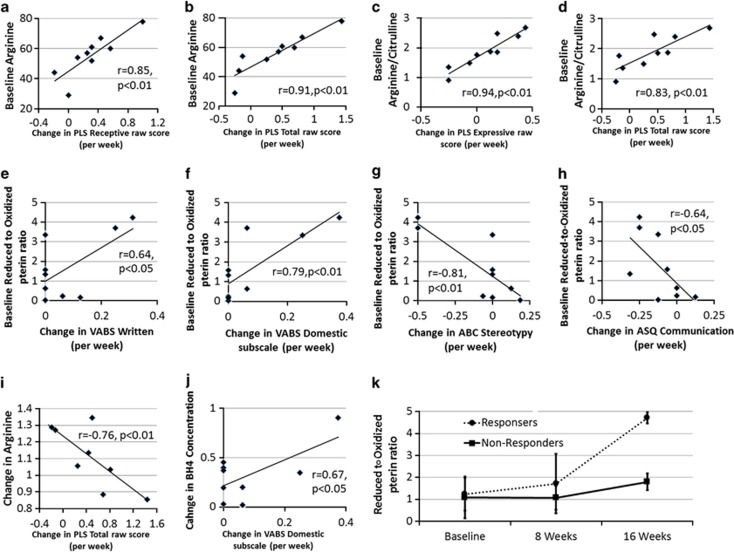
Figure 4.
Significant relationships between outcome variables and biomarkers. Many of the relationships found included relationships between biomarkers of nitric oxide metabolism and primary and secondary outcome variables. The relationships presented were identified using linear regression models. Pearson correlations were used to investigate the identified relationships between the outcome variable and the biomarker. P-values represent one-tailed statistical test as the direction of the relationships were predicted. Change values were calculated in change in value per week of treatment. (a–h) Relationships between outcome variables and baseline biomarker values. (i, j) Relationships between outcome variables and changes in biomarkers over the treatment period. (k) Changes in two nitric oxide metabolism biomarkers over the treatment period for four responders and four nonresponders. From these graphs it is clear that responders and nonresponders demonstrated different profiles of changes in nitric oxide metabolism.

