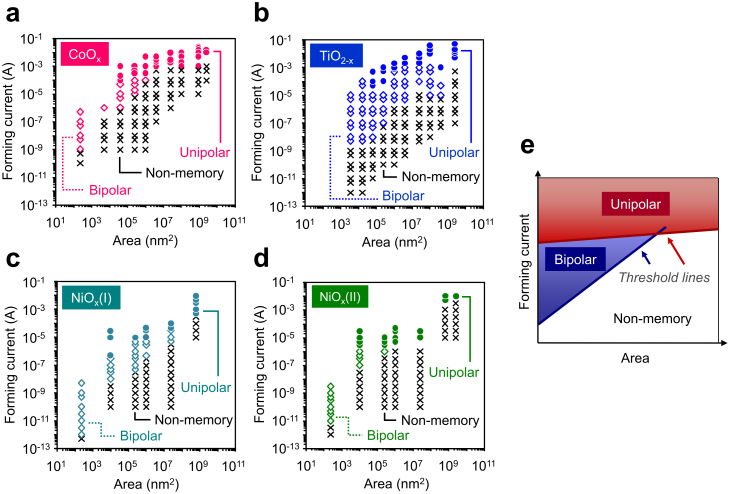
Figure 2. Diagram of a cell area and a forming current to classify the emergence of electrical polarity characteristics in resistive switching behaviors.
(a) Diagram as to variation of polarity characteristics in switching behaviors for CoOx. (b) Diagram as to variation of polarity characteristics in switching behaviors for TiO2−x. (c) and (d) Diagrams as to variations of polarity characteristics in switching behaviors for NiOx(1) and NiOx(2). The data of two different NiOx layers were shown when changing the deposition conditions of NiOx layers. (e) Schematic of observed scaling trends on the emergence of the two electrical polarity characteristics when varying a cell area and a forming current.

