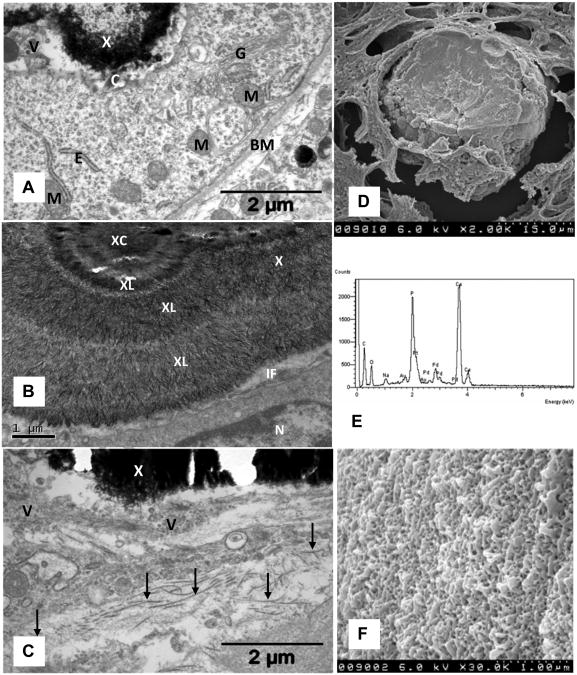
Figure 4.
Electron microsc analyses of crystal deposis. A. Crystal deposit (X) adjacent to a tubular epithelial cell which shows active golgi apparatus (G), endoplasmic reticulum (E), mitochondria (M), cilium (C), basement membrane (BM). Interface between crystal and cell is filled with vesicles. B. High magnification showing nucleus (N) of an epithelial cell, a tight interface (IF) filled with small membrane bound vesicles. Crystal deposit shows a central area (XC) surrounded by concentric layers (XL) of radially organized thin plate-like crystals. C. Interstitially located crystal deposit (X) associated with membrane bound vesicles (V) of various sizes and collagen fibers (arrows). D. Scanning electron microscopy of the deposit completely filling the tubular lumen. E. Energy dispersive microanalysis of crystal deposit showing the presence of calcium (Ca) and phosphorus (P). F. High magnification of deposit surface showing variously arranged plate-like crystals (Compare with 2B, 4B).

