
Figure 6.
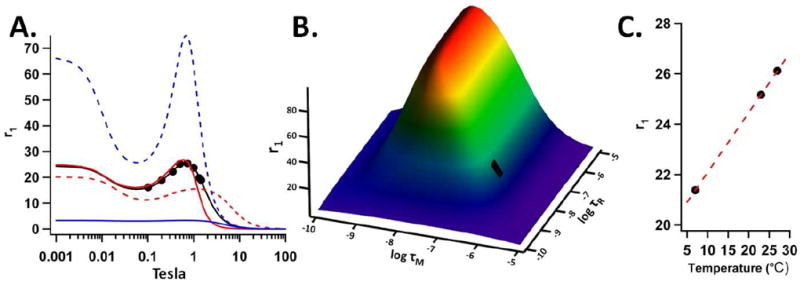
(A) The experimental relaxivity data (black points) and a SBM fit (solid black line) to these data. NMRD profiles with the q and τM equal to the fit values and a lower τR value (τR = 7.6 · 10-10, red dotted line) and higher value (τR = 7.6 · 10-8, red solid line). Also profiles with the q and τR equal to the fit values and a lower τM value (τM = 7.6 · 10-10, blue dotted line) and higher value (τR = 7.6 · 10-8, blue solid line). (B) A plot of the relaxivity as calculated by the SBM model as a function of τR and τM at 0.73Tesla (31MHz) and q = 1.1. The black rectangle indicates the region corresponding to τR and τM values returned by the SBM fit to the experimental data. (C) A plot of r1 vs. temperature for the Hsp hybrid construct at 0.5Tesla (21MHz). Each experimental data point in (A) and (C) was produced by averaging both batches of the passivated and non-passivated preparations for G0.0, G0.5, G1.5, G2.5 and G3.5 and r1 is the ionic relaxivity with units of mM-1 sec-1.