
Figure 1.
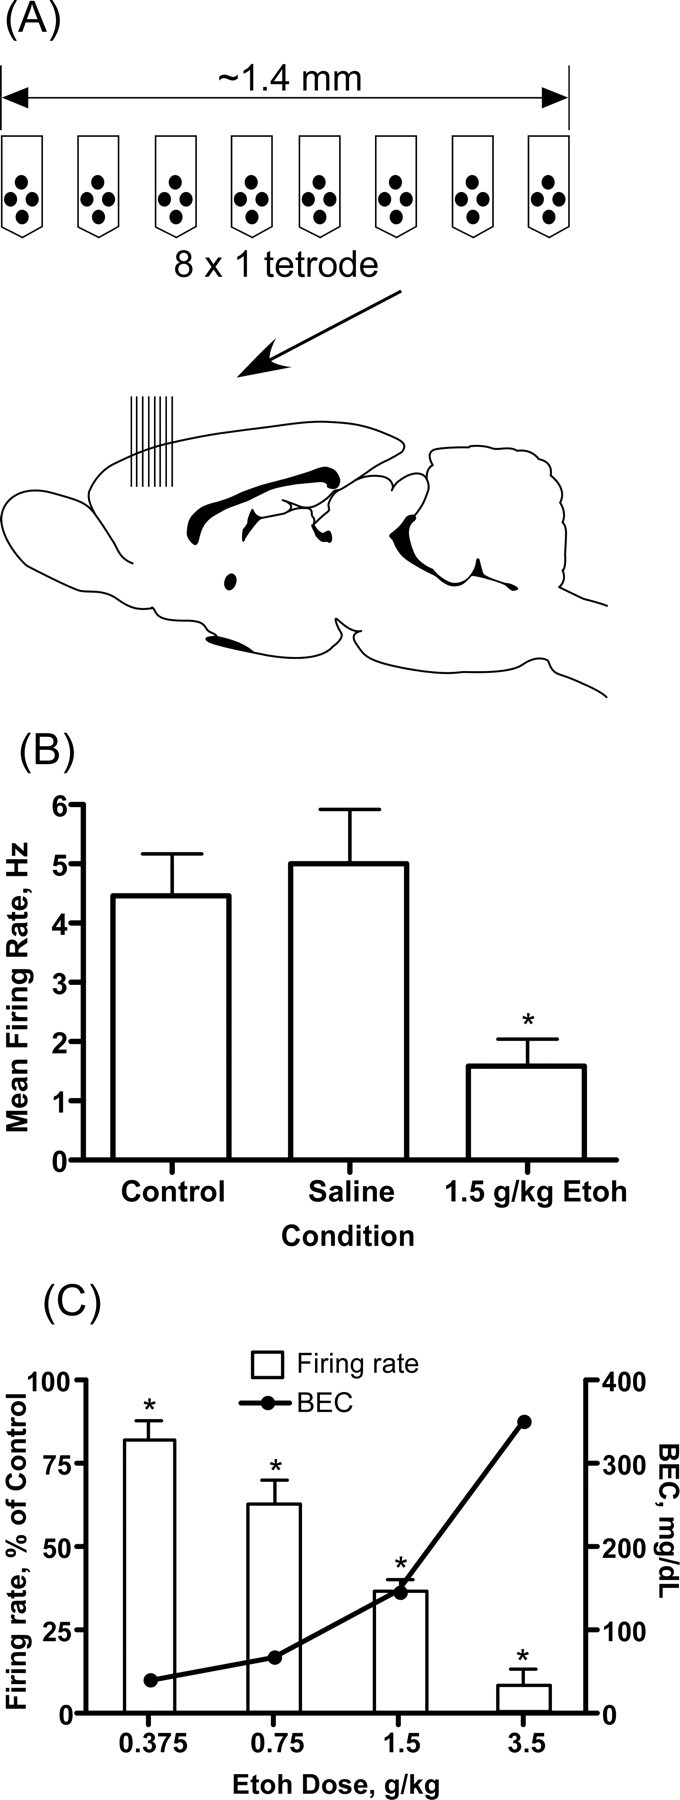
Effects of ethanol on PFC neuron firing in vivo. A, Top, Schematic showing orientation of the electrodes used to record spike activity in the PFC. Each of the eight arms contains four electrodes separated by 25 μm. Bottom, Sagittal section of the rat brain with the approximate location of the recording electrode (arrow and vertical bars). B, Representative exper-iment showing the effect of ethanol on the mean firing rate of PFC neurons. These results are from a single animal and each bar represents the mean (±SEM; n = 13 neurons per group) firing rate of all neurons measured during a 5 min period 30 min after either saline or ethanol (1.5 g/kg, i.p.). C, Dose dependence of the ethanol inhibition of PFC firing. Error bars represent the mean (±SEM; n = 15–17 neurons per concentration; 1 animal for each concentration) percent inhibition (left y-axis) of firing by ethanol relative to the control period. Closed circles show the blood ethanol concentration (right y-axis) 30 min after an intraperitoneal injection of ethanol. *Significantly (p ≤ 0.05, paired t test) different from corresponding control response.