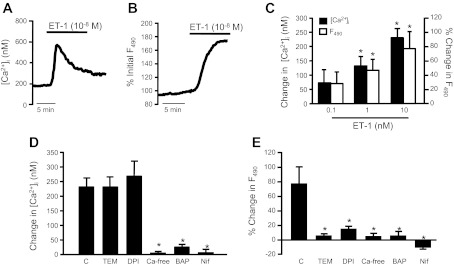
Fig. 5.

Effect of ET-1 on intracellular Ca2+ concentration ([Ca2+]i) and reactive oxygen species (ROS) generation. [Ca2+]i and ROS were measured via fluorescent microscopy with the intracellular dyes fura 2 and H2DCFDA, respectively, in PASMCs challenged with ET-1. A: change in [Ca2+]i in response to ET-1. B: change in ROS in response to ET-1. C: bar graphs show mean change in DCF fluorescence (F490) and [Ca2+]i in response to increasing concentrations of ET-1 and H2O2 (n = 3–7). D and E: PASMCs were pretreated with the antioxidants 4-hydroxy-2,2,6,6-tetramethylpiperidinyloxy (TEM; 10 mM), a membrane permeable superoxide scavenger, or diphenyleneiodonium (DPI; 10 mM), an oxidase inhibitor, the intracellular Ca2+ chelator BAPTA (BAP), the l-type Ca2+ channel inhibitor nifedipine (Nif), or the absence of extracellular calcium (Ca-free) before challenge with ET-1 (n = 3–7). For all bar graphs, mean ± SE values are shown. *P < 0.05 vs. control (C).
