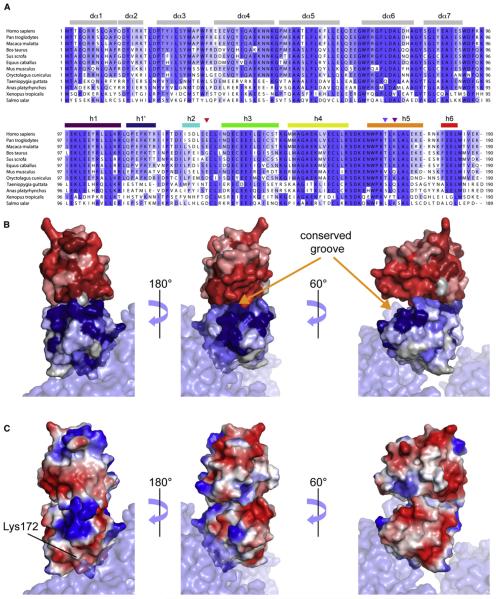
Figure 8. Sequence Alignment of CARD12 across Species.
(A)The color coding reflects sequence conservation. Secondary structure elements are shown in gray for CARD1 with helices numbers corresponding to the structure of duck CARD12, while we used the same color coding as in Figure 1 for CARD2. Triangles are used to identify residues Glu129, Thr170 and Lys172. The figure was prepared with Jalview (Waterhouse et al., 2009).
(B and C) The structure of human CARD2 was aligned to CARD2 from the duck RIG-IΔCTD crystal structure (PDB code 4A2Q, molecule A). (B) Representation of the conservation of surface residues in CARD12. The color coding is identical as in (A) for CARD2 and similar, in shades of red for CARD1. (C) Surface electrostatics of human CARD2 and a model of CARD1 based on the structure of duck CARD1. See additional representations in Figure S4.

