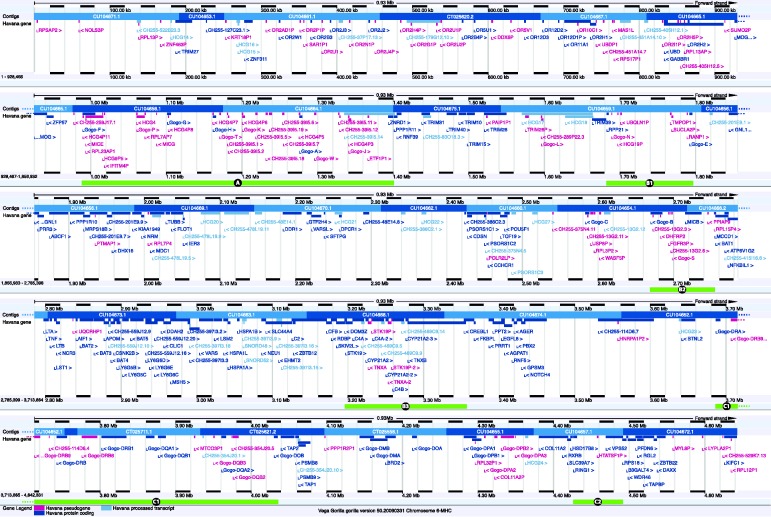
Figure 1.
Feature map of the gorilla MHC, modified from the VEGA browser (release 50, December 2012). Each locus is labelled with a name, coloured according to type (see legend at bottom) and with indication of orientation (angle bracket before or after the name) and position within the region. The tiling path of the sequenced BACs is shown at the top of each panel (labelled contigs), with clones in alternating dark and light blue and, space permitting, with accession numbers. At the top and bottom of each panel, a size scale is shown. The regions highlighted in Figure 2 are marked with green bars at the bottom of a panel and labelled with the figure section identifier.

