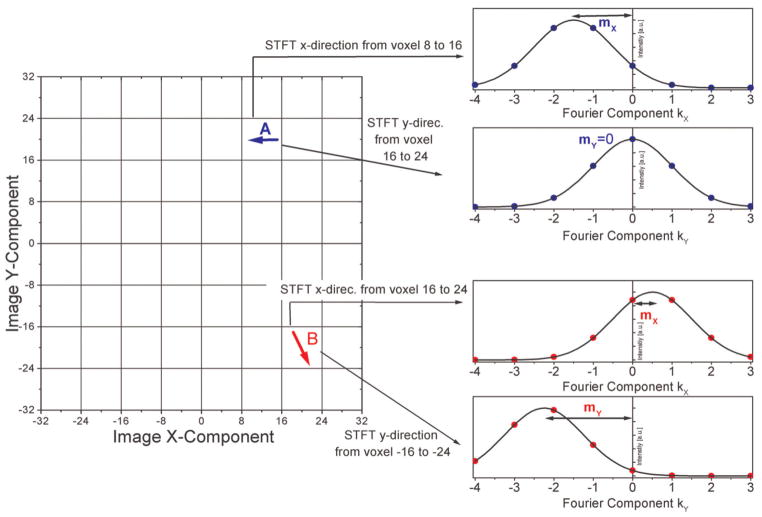
FIG. 2.
Exemplified visualization of the echo shift in “short-term” k-space (right) that is induced by susceptibility gradients indicated in the image-space grid (left). These are indicated by arrows in the image-space pointing in the direction of the susceptibility gradient. By fitting, e.g., a Lorentzian-shaped curve to the data, the position of the maximum can be determined in the low-resolution “short-term” k-space. By repeating this procedure also in the z-direction, a susceptibility gradient vector is generated. [Color figure can be viewed in the online issue, which is available at www.interscience.wiley.com.]

