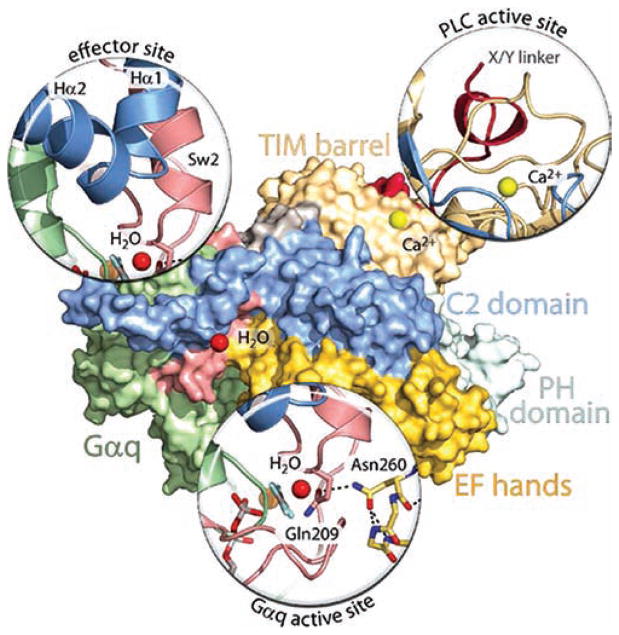
Figure 4.
Key interfaces in Gαq-promoted activation of PLC-β and PLC-β-promoted hydrolysis of GTP by Gαq. Essentially the same orientation of the Gαq/PLC-β3 structure21 used in Figure 2 is shown as a surface map using the same colors as in Figure 2 to depict the various regions in PLC-β3 and Gαq. “Magnified” representations are utilized to show the key interactions responsible for Gαq binding (effector site), for autoinhibition of the lipase (PLC active site), and for PLC-β-mediated promotion of GTP hydrolysis by Gαq (Gαq active site). The effector site magnification highlights the interaction of the helix—turn—helix region of PLC-β3 with switch regions of activated Gαq. The PLC active site magnification highlights the occlusion of the active site of the lipase by the X/Y-linker region (red) of the PLC. The Gαq active site magnification highlights the interaction of the side chain nitrogen of Asn260 of the EF-hand 3/4 loop of PLC-β3 with the side chain carbonyl of Gln209 of the GTP-binding region of Gαq. The catalytic H2O (red sphere) orients the views of the effector-binding site and GTP-binding region of Gαq, and the Ca2+ cofactor (yellow sphere) orients the view of the PLC active site.

